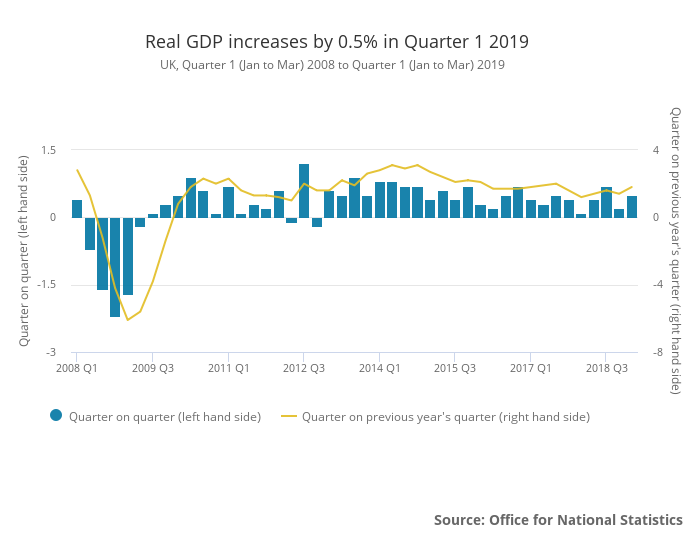
UK gross domestic product (GDP) in volume terms was estimated to have increased by 0.5% in Q1 (January to March) 2019. In comparison with the same quarter a year ago (Q1 2018) UK GDP increased by 1.8%, the fastest growth since Q3 2017.
Main points:
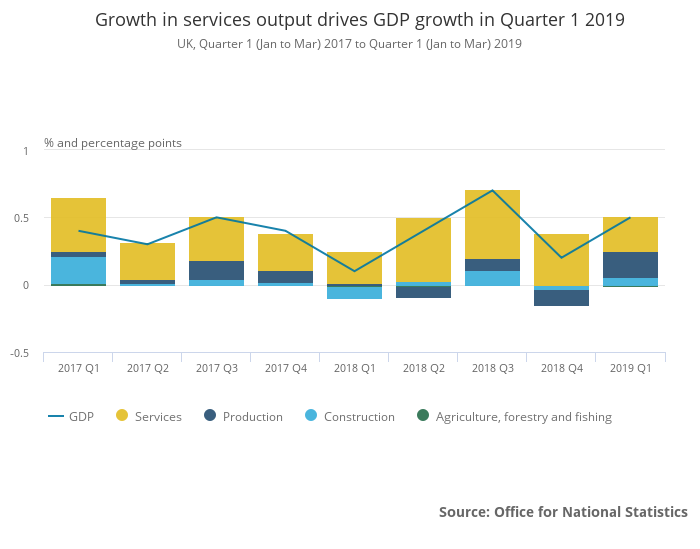
- Growth in the services sector slowed to 0.3% in the quarter.
- There was a noticeable pickup in growth in the production sector, driven by growth of 2.2% in manufacturing output.
- Private consumption, government consumption and gross capital formation contributed positively, while net trade contributed negatively to GDP growth.
- The trade deficit widened to 3.4% of nominal GDP in Q1 2019.
- Gross fixed capital formation increased by 2.1% in the quarter, with strong growth in government investment.
- Business investment increased by 0.5% in Q1 2019 following four quarters of contraction.
Manufacturing output soars
Production output increased by 1.4% in Q1 2019, within which manufacturing output increased by 2.2%. Services output growth slowed to 0.3% in Q1 2019, while construction output increased by 1.0%. Output of the agriculture, forestry and fishing sector fell by 1.8%, providing the only negative contribution to growth.
Trade deficit widens
The trade deficit widened to 3.4% of nominal GDP in Q1 2019.Export volume growth was flat, while import volumes increased by 6.8%, resulting in net trade being a significant drag on GDP growth in the quarter.
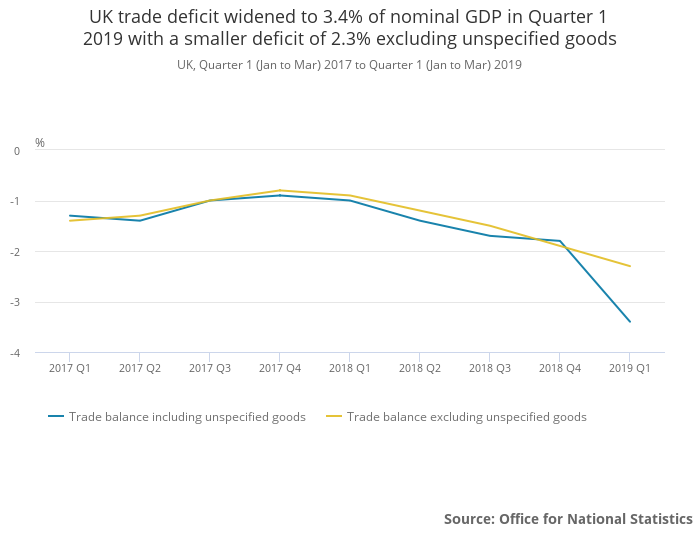
Trade in goods exports grew by 4.5% in Q1 2019, reflecting increases in machinery and transport equipment and miscellaneous manufactures, while trade in services exports fell by an offsetting 5.0% due to falls in telecommunications, computer and information technology, intellectual property and other business services. The rise in imports reflects a 11.0% increase in trade in goods imports, partially offset by a 4.4% fall in trade in services imports.
UK Related:
The UK faces three immediate economic challenges irrespective of what happens with BrexitThe Real Economics of Brexit
Here are UK household spending insights
The UK’s net worth is now estimated at £10.2 trillion, an average of £155000 per person
This is how wealthy UK households are
UK households have seen their outgoings surpass their income for the first time in nearly 30 years
The UK economy a decade on from the 2008 recession
Nominal wages in the UK grew fastest in a decade but real wages are still lower than a decade ago
UK 2018 GDP growth estimated at 1.4%
GDP Related:
Eurozone Q1 2019 GDP up by 0.4% and European Union Q1 2019 GDP up by 0.5%; Italy out of Recession