2019 was a historic year for many reasons. Record returns on stocks, bonds and other assets. 2019 – this time it was different. And 2020? This time it will again be different, very different.
Can asset prices keep soaring?
A question that many people have is – how long can the equity markets keep soaring, how long can house prices keep increasing and how long can demand for negative yielding government bonds continue?
The answer to all of the above is probably (but not necessarily) indefinitely. In many ways we are living in very interesting times. This time it is different, why wouldn’t it be?
The U.S. equity market meltdown in numbers
Records are being broken shattered …
Continue reading “The U.S. equity market meltdown in numbers”
Almost every major Wall Street strategist has been way off with their target for the S&P 500 for 2018 yet their 2019 targets are mostly bullish again
We look back at 2018 year end S&P 500 targets as 2018 draws to a close. The S&P 500 is currently down about 3% year to date and unless something drastic happens almost every major Wall Street strategist will be way off with their target for the S&P 500 for 2018. We also look at 2019 targets which are all bullish again. Will the predictions for 2019 be any better on target than they were for 2018?
Red everywhere – Here’s how Equity, Commodity and Bond Markets have performed over the past year
Here is the 1-year change for Equity, Commodity and Bond Markets (all as of end of day December 13, 2018),
Equities
Red almost everywhere with China down 20%, Germany down 16%, South Korea down 15%, U.S. almost flat (Dow Jones and S & P 500 flat with NASDAQ 100 up 6%) and star performer Brazil up 21%
Between January to the October peak, the FAANG stocks accounted for 82% of all the gains for the S & P 500 and the NASDAQ 100; The only stock to decelerate the stock market fall is … Microsoft
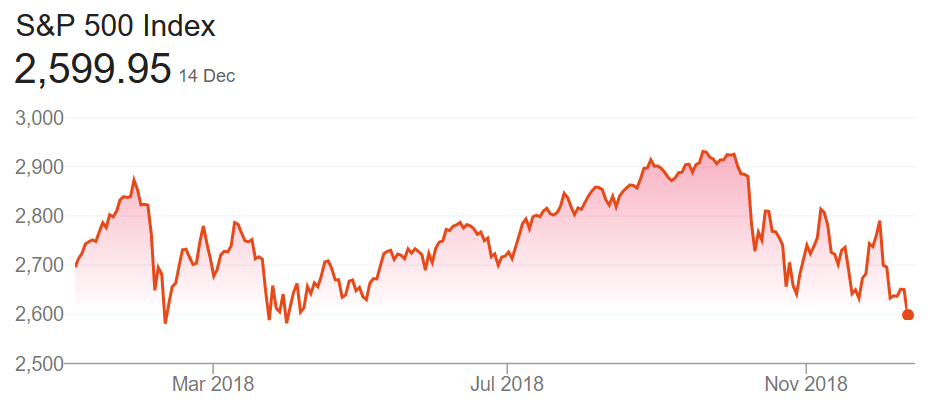
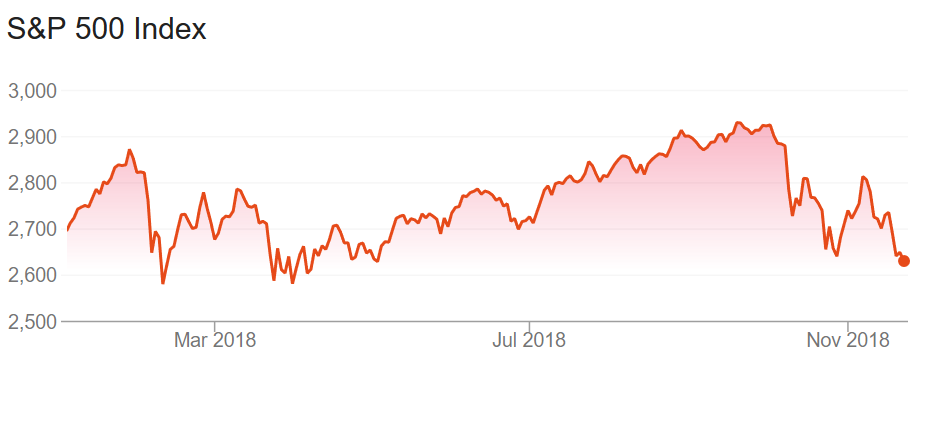
The S & P 500 and the NASDAQ 100 hit all time highs in early October and since then they have fallen about 10% each. The S & P 500 has turned negative for the year and the NASDAQ 100 has barely moved. FAANG (Facebook, Amazon, Apple, Netflix and Google/Alphabet) stocks accounted for almost all the 2018 gains until October. And their fall has caused the market meltdown but there is more to the story …
Technology Companies granted an astonishing amount of Restricted Stock Units by value in 2017 (and banks were left way behind)
Restricted Stock Units (RSU) are company stock (or shares by another name) granted to employees as a form of compensation. Employers save some tax, and it generally aligns the long-term interest of employees (and shareholders) as it normally carries a vesting period. 2017 was great for technology company share prices and technology companies granted an eye-watering amount of Restricted Stock Units by value leaving banks way behind …
Gold, Equities or Property? Here’s how much each has returned since 1990, 2000, 2010 and since Lehman
Has Gold, U.S. Equities or U.S. Property performed the best? We compare the performance of each and the results are surprising.
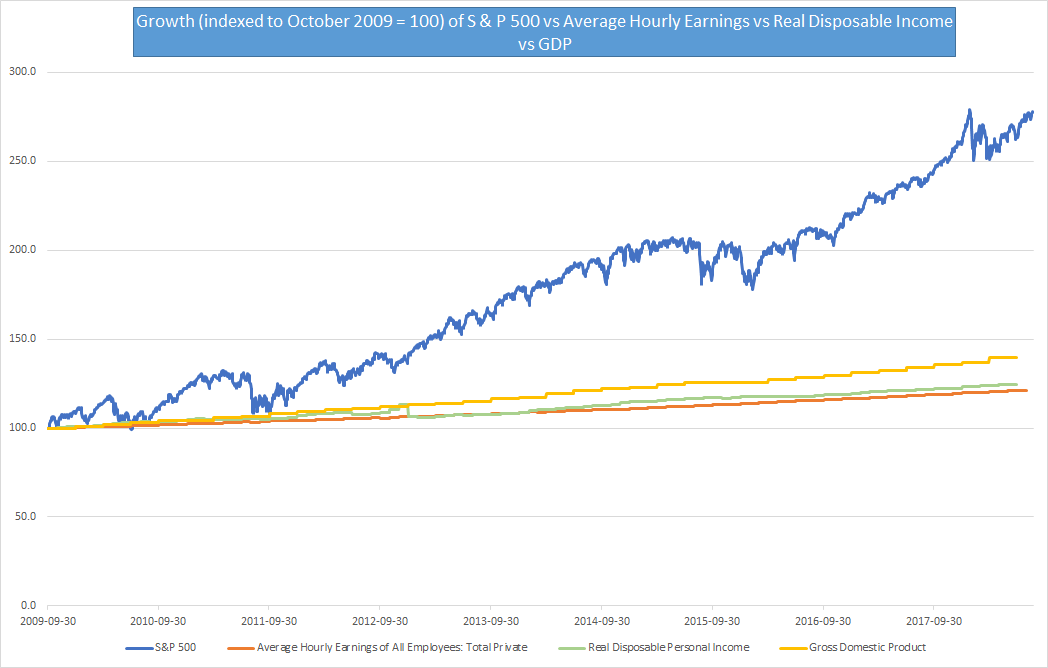
The S & P 500 is up 180% since the end of the last U.S. recession but the average wage is only up 21.2%, disposable income up 24.6% and GDP up 39.5%
The S & P 500 has had a stellar run of nine and a half years of gains closing at a new high in the week gone by. It is up 300% since the 9th of March 2009 when it hit a multi-year low in the aftermath of the financial crisis. Even considering the time post the end of the last U.S. recession, the S & P 500 has outperformed every major financial metric by a big margin.
Something strange is happening in the global economy right now
Everyone seems to be focussing on the equity markets recently, but equity markets haven’t really moved much over the past one month. Over the past month, major equity markets have lost between 1.5% to 4%.
The real action is in bonds and commodities. And trade seems to be flourishing too.
10-year government bond yields of major economies are lower by 5% to 40% (in relative terms not absolute terms) in just the past month. 10-year German bonds are down 12 bps over the past month. That wouldn’t sound much but they are down 28% from 42 bps to 30 bps. U.K. yields are down 8%, U.S. yields down 5%, Japanese yields down 40%. Even Greek yields are down 20% over just the past month. Does the market anticipate a pause in interest rate rises? It would appear so.
Continue reading “Something strange is happening in the global economy right now”