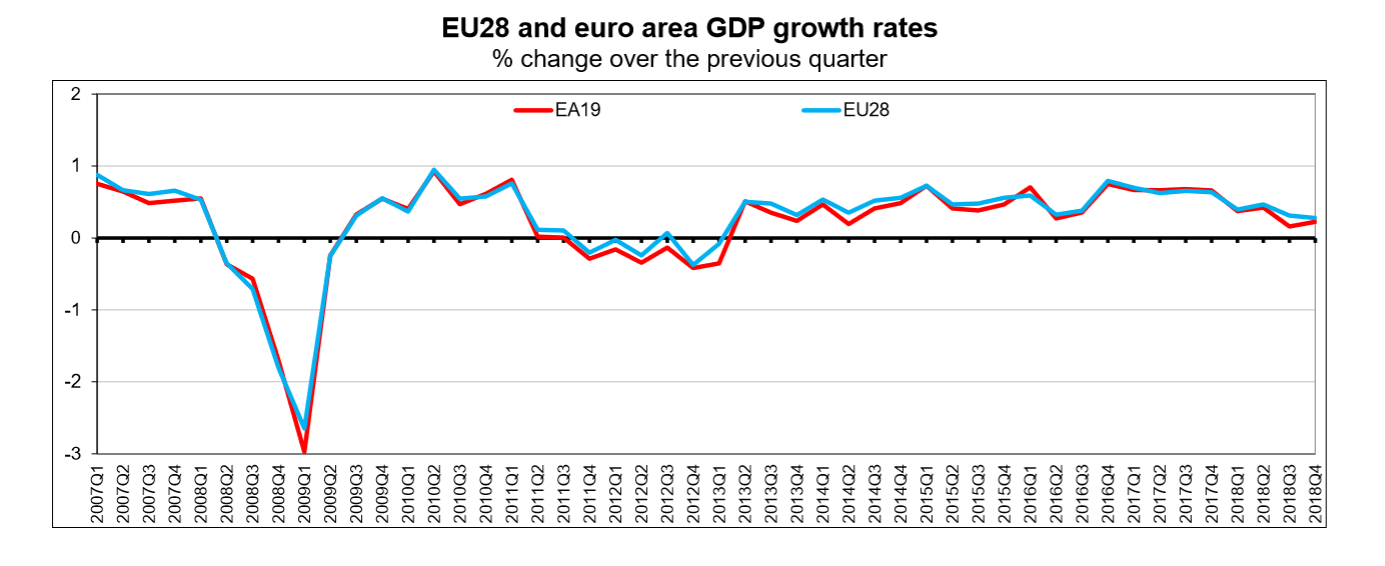
Seasonally adjusted GDP rose by 0.2% in the Euro area or Eurozone (EA) and by 0.3% in the European Union (EU) during Q4 2018, compared with Q3 2018.
Why wouldn’t it be?
Seasonally adjusted GDP rose by 0.2% in the Euro area or Eurozone (EA) and by 0.3% in the European Union (EU) during Q4 2018, compared with Q3 2018.
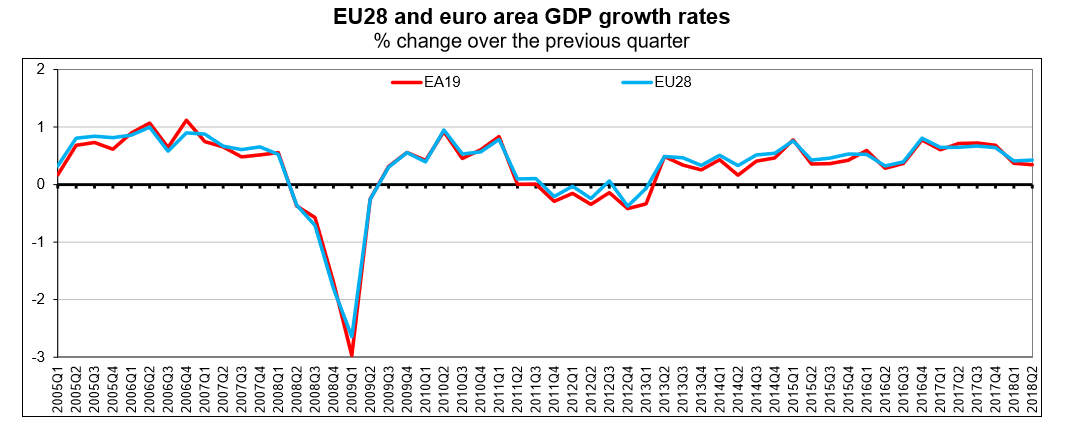
Seasonally adjusted GDP rose by 0.2% in the Eurozone or Euro Area and by 0.3% in the European Union (EU) during the third quarter of 2018, compared with the previous quarter, according to a preliminary flash estimate published by Eurostat, the statistical office of the European Union. In the second quarter of 2018, GDP had grown by 0.4% in the euro area and by 0.5% the European Union.
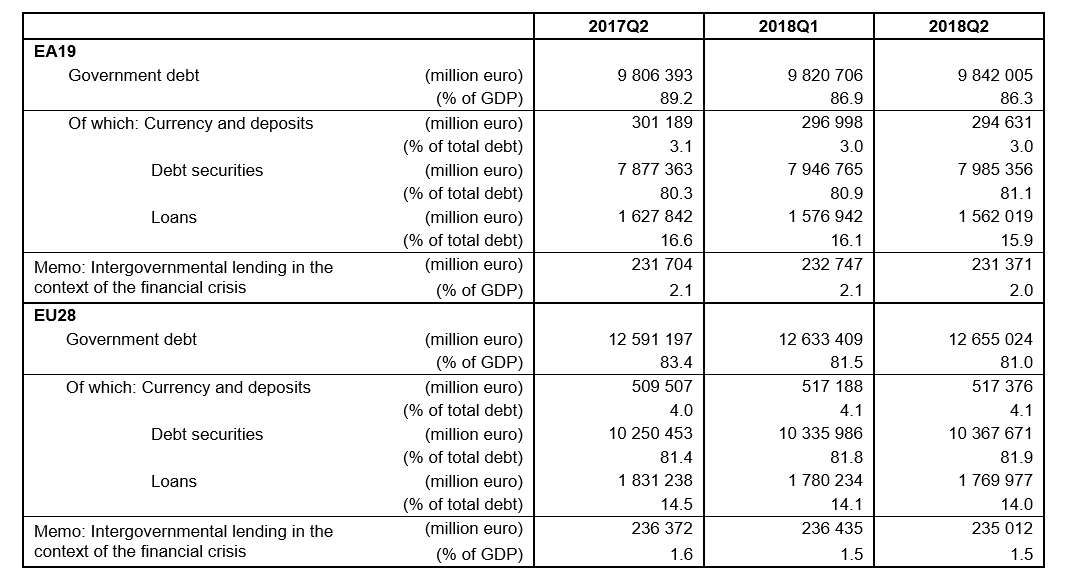
At the end of the second quarter of 2018, the government debt to GDP ratio in the Euro area (EA19) or Eurozone stood at 86.3% and in the European Union (EU28) the ratio stood at 81%.
We will be publishing a number of statistics for the United Kingdom (and the European Union) over the next few days in the run up to a major piece we will be publishing on the real economics of Brexit.
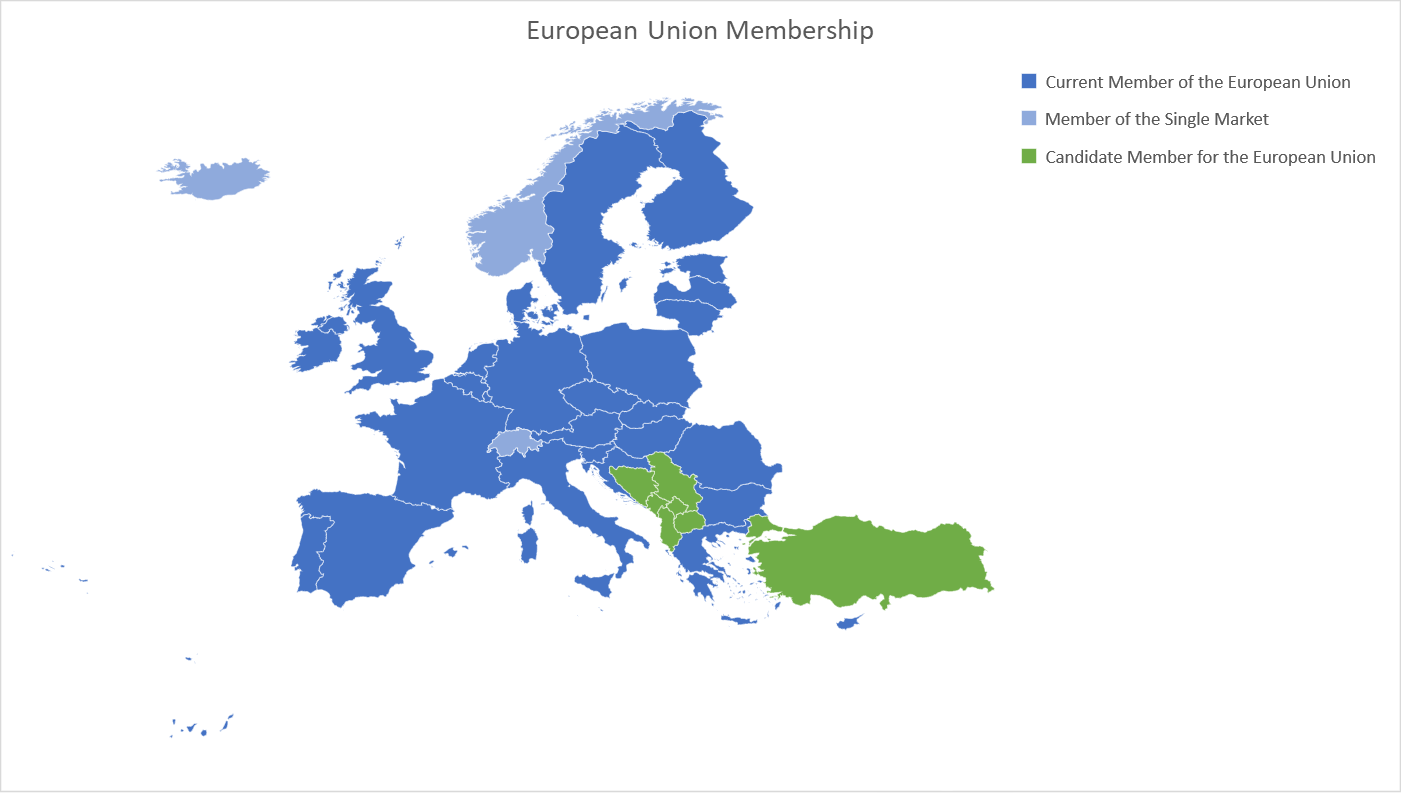
Montenegro, the former Yugoslav Republic of Macedonia, Albania, Serbia, Turkey, Bosnia and Herzegovina and Kosovo are countries on the road to join the European Union.
We will be publishing a number of statistics for the United Kingdom (and the European Union) over the next few days in the run up to a major piece we will be publishing on the real economics of Brexit.
We couldn’t find any official Money Velocity numbers for the Euro Area (Eurozone) so calculated it using the Equation of Exchange
Equation of Exchange
MV=PQ
Money Supply (M) * Money Velocity (V) = Price level (P) * Real economic output (Q)
Which means Money Supply * Money Velocity = Nominal GDP
Therefore, Money Velocity = Nominal GDP/Money Supply
We have the numbers for both Money Supply (from OECD – Organization for Economic Co-operation and Development) and Nominal GDP (from Eurostat) for the Euro Area.
Continue reading “Euro Area or Eurozone Money Velocity seems to be shockingly low”
We will be publishing a number of statistics for the United Kingdom (and the European Union) over the next few days in the run up to a major piece we will be publishing on the real economics of Brexit.
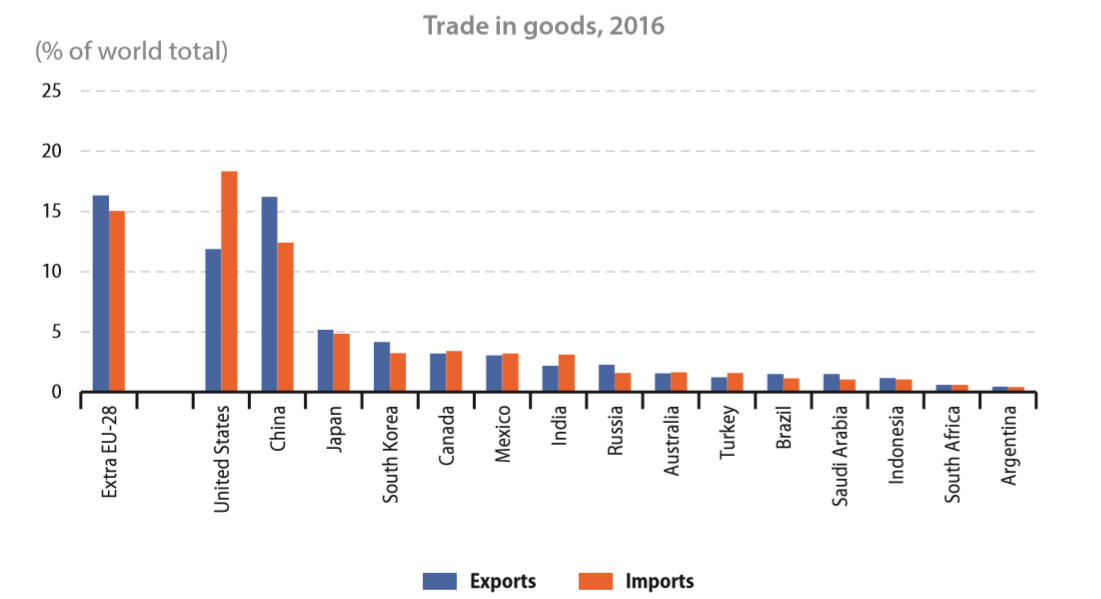
The European Union (EU28 or EU) accounted for around one sixth of world trade in goods in 2016, with a 16.3% share of exports and a 15.0% share of imports. Turning to services the EU28’s contribution to world trade (mainly due to the United Kingdom which is leaving the European Union) was even greater, totalling 24.7% of exports and 21.1% of imports.
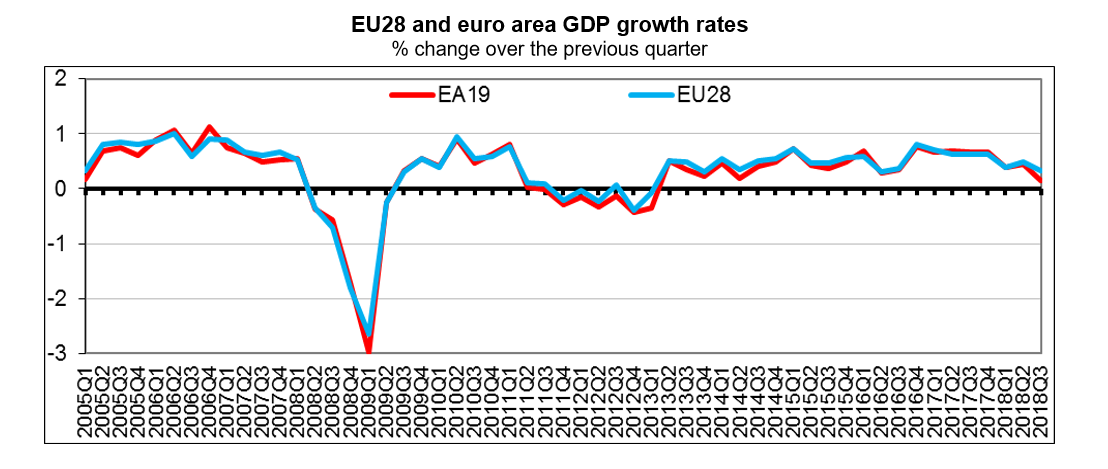
Seasonally adjusted GDP rose by 0.3% in the Eurozone and by 0.4% in the European Union (EU28) during the second quarter (Q2) of 2018, compared with the previous quarter, according to a preliminary flash estimate published by Eurostat, the statistical office of the European Union.
The first estimate for the European Union exports of goods in May 2018 was €160.9 billion, down by 2.7% compared with May 2017 (€165.4 bn). Imports from the rest of the world stood at €160.7 bn, down by 1.4% compared with May 2017 (€163.0 bn). As a result, the European Union recorded a €0.2 bn surplus in trade in goods with the rest of the world in May 2018, compared with a surplus of €2.3 bn in May 2017. Intra-European Union trade rose to €294.7 bn in May 2018, +1.6% compared with May 2017.
In January to May 2018, the European Union exports of goods rose to €786.6 bn (an increase of 1.5% compared with January-May 2017), while imports rose to €795.7 bn (an increase of 1.6% compared with January-May 2017). As a result, the European Union recorded a deficit of €9.1 bn, compared with a deficit of €8.1 bn in January-May 2017. Intra-European Union trade rose to €1457.3 bn in January-May 2018, +4.6% compared with January-May 2017.

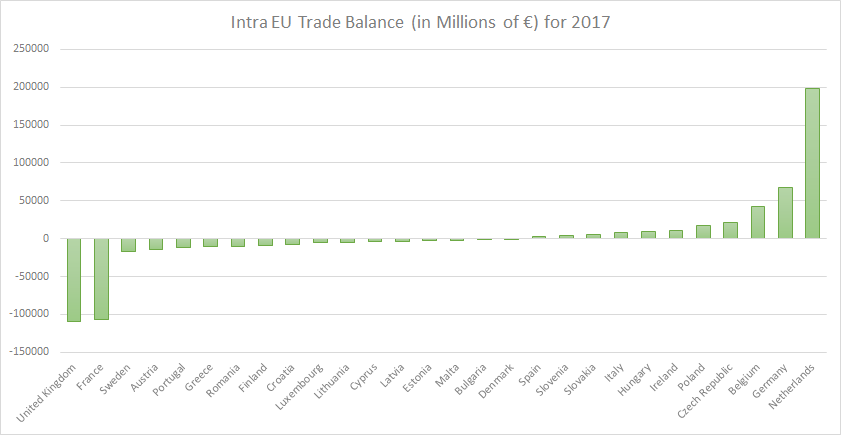
Some surprises in Intra European Union (EU) Trade Statistics for 2017: Germany was the largest exporter as expected but unexpectedly also the largest importer. The Netherlands (and not Germany) had the largest trade surplus. The United Kingdom had the largest trade deficit (no trade deal Brexit still on the table?)
Here is additional information, the complete dataset and maps,