Unemployment in Europe is lowest since 2008 but is still twice that of the United States

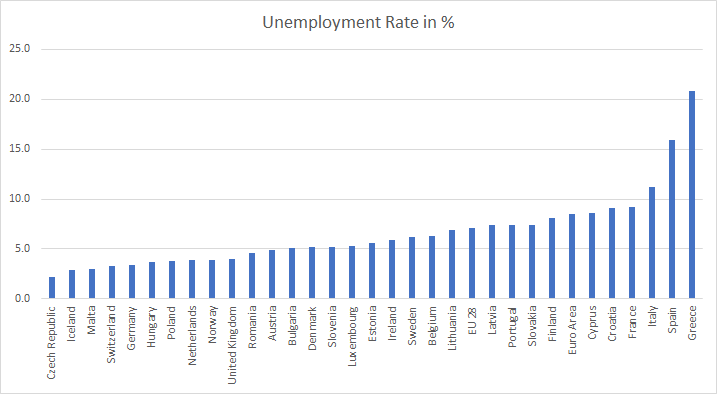
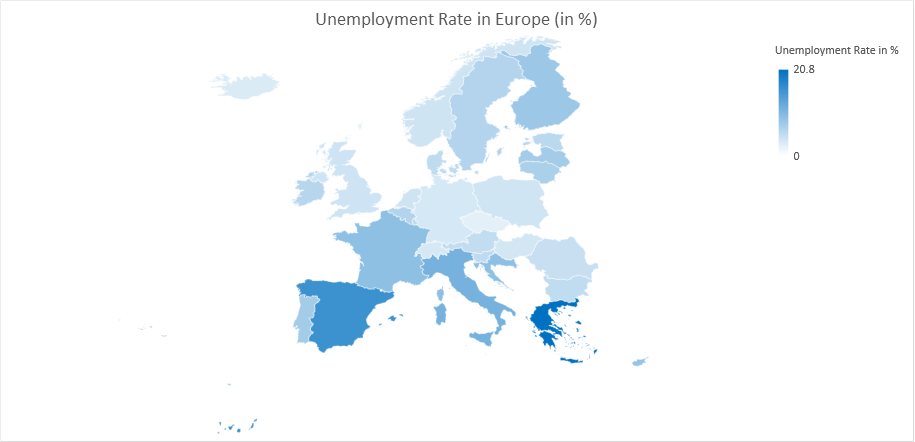
The Euro Area unemployment rate was 8.5% in April 2018, down from 8.6% in March 2018 and from 9.2% in April 2017. This is the lowest since December 2008 but still more than double of the US unemployment rate of 3.9% reported in April (the US unemployment rate further fell to 3.8% in May). The EU28 unemployment rate was 7.1% in April 2018, stable compared with March 2018 and down from 7.8% in April 2017. This remains the lowest rate recorded in the EU28 since September 2008.

Data Source: Eurostat (for the European Union and Iceland), State Secretariat for Economic Affairs (for Switzerland), Office for National Statistics (for the United Kingdom)

Continue reading “Unemployment in Europe is lowest since 2008 but is still twice that of the United States”

European Union Trade Statistics for January to March (Q1) 2018

Key highlights

  • The total trade surplus for the European Union increased from €15.6 bn in Q1 2017 to €19.1 bn in Q1 2018, total exports were 1.34 trillion and total imports were 1.33 trillion
  • 10 of the 28 European Union countries had a trade surplus in Q1 2018 and 18 had a trade deficit
  • Germany had the largest trade surplus in Q1 2018 at €62.2 bn, Netherlands at €15.8 bn and Ireland at €12.4 bn
  • The United Kingdom had the largest trade deficit in Q1 2018 at €41.1 bn, France at €21.2 bn and Spain at €7.9 bn

Continue reading “European Union Trade Statistics for January to March (Q1) 2018”

Europe’s lost economic decade in charts

  • Parts of the European Union have seen GDP per capita shrink between 2007 and 2017 and the overall compounded annual growth rate for the European Union was just 1.2%
  • GDP growth for the European Union between 2007 and 2017 adjusted for inflation was negative
  • Banks in Greece, Cyprus, Portugal and Italy have a non-performing loan ratio of over 10% a decade on from the financial crisis and have only provisioned around 50% of the losses
  • The European Central Bank (ECB) is by far the biggest holder of European bonds and has a balance sheet of €4.5 trillion or some 45% of the GDP of the Eurozone
  • 18 of the 28 countries that are part of the European Union have seen house prices fall between 2008 and 2017
  • Greece has been the worst affected country, with its stock market down 85% since 2007, GDP per capita down 22% since 2007, house prices down 43% since 2008 and banks in Greece currently have a non-performing loan ratio of 42%
  • Eurozone Debt as % of GDP is gradually falling but is still historically high
  • Since the financial crisis of 2008, economic uncertainty has seen falling fertility rates for the European Union with population now set to fall over the coming decades

Continue reading “Europe’s lost economic decade in charts”

Parts of the European Union have seen nominal GDP per capita fall between 2007 and 2017

We have been analysing some numbers from the latest releases from Eurostat (the official statistical office of the European Union), the International Monetary Fund, the Federal Reserve, the European Central Bank, the Bank of England and the Bank of Japan.

We will be posting several findings in the next couple of days. We begin with GDP per capita between 2007 and 2017 for countries which are part of the European Union based on a statistical release from the Eurostat.

EU GDP Per Capita 2007 to 2017
Data Source: Eurostat

Continue reading “Parts of the European Union have seen nominal GDP per capita fall between 2007 and 2017”