We have been analysing some numbers from the latest releases from Eurostat (the official statistical office of the European Union), the International Monetary Fund, the Federal Reserve, the European Central Bank, the Bank of England and the Bank of Japan.
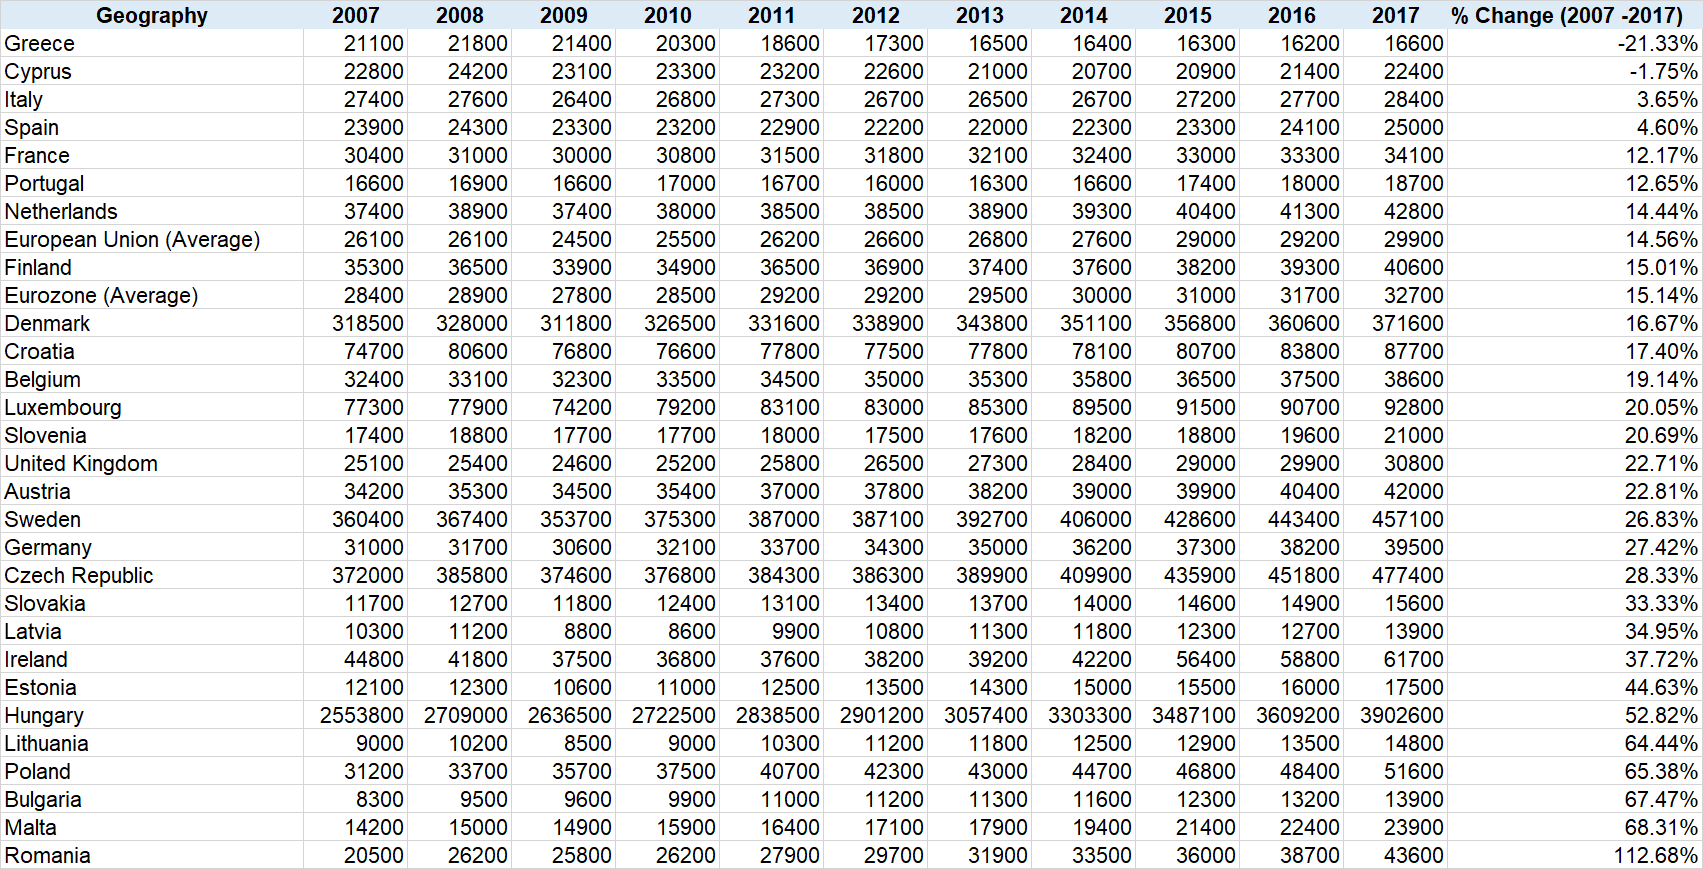
We will be posting several findings in the next couple of days. We begin with GDP per capita between 2007 and 2017 for countries which are part of the European Union based on a statistical release from the Eurostat.
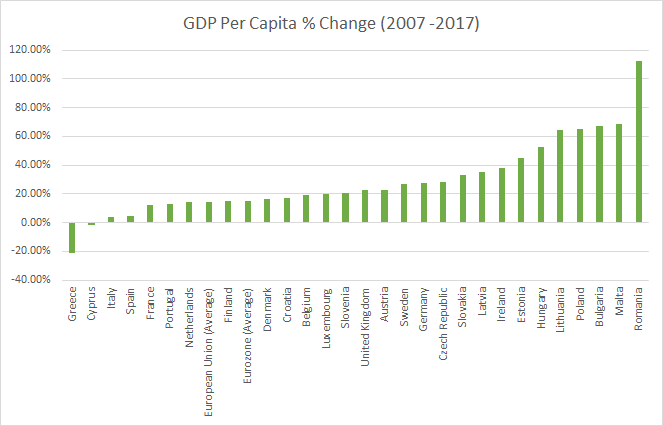
Parts of the EU have seen GDP per capita shrink and the overall compounded annual growth rate is just 1.2%. GDP growth adjusted for inflation is actually negative. Has the global economy really recovered from the last financial crisis?