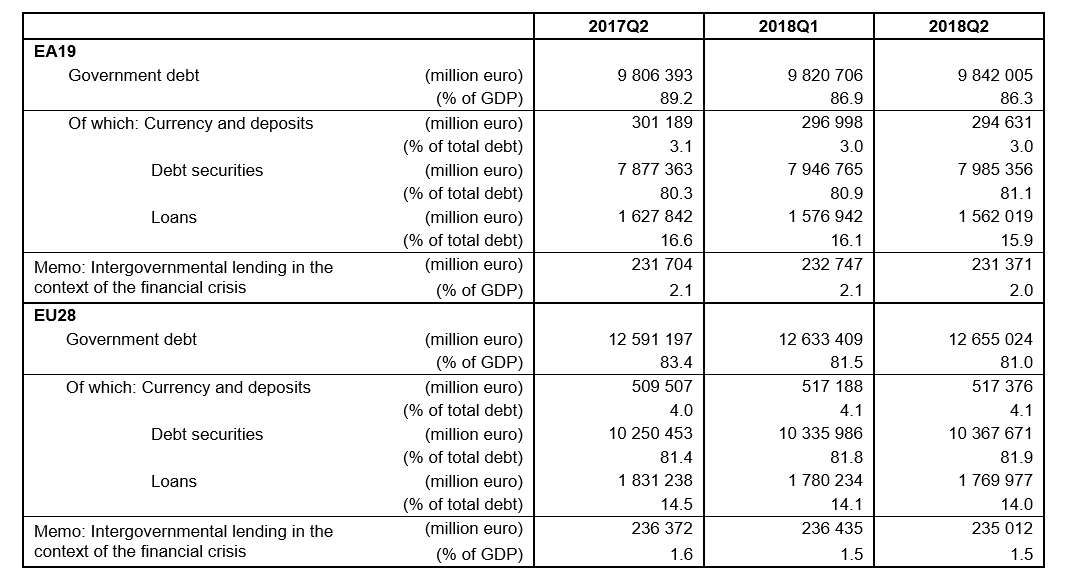
Government debt to GDP for the Eurozone stood at 85.9% at the end of Q1 2019 (as against 87.1% at the end of Q1 2018). For the European Union, the number was 80.7% (as against 81.6% at the end of Q1 2018).
How big really is the total debt of the United States?
The answer is different on how you look at it – in terms of absolute outstanding debt, growth rates and relative to GDP.
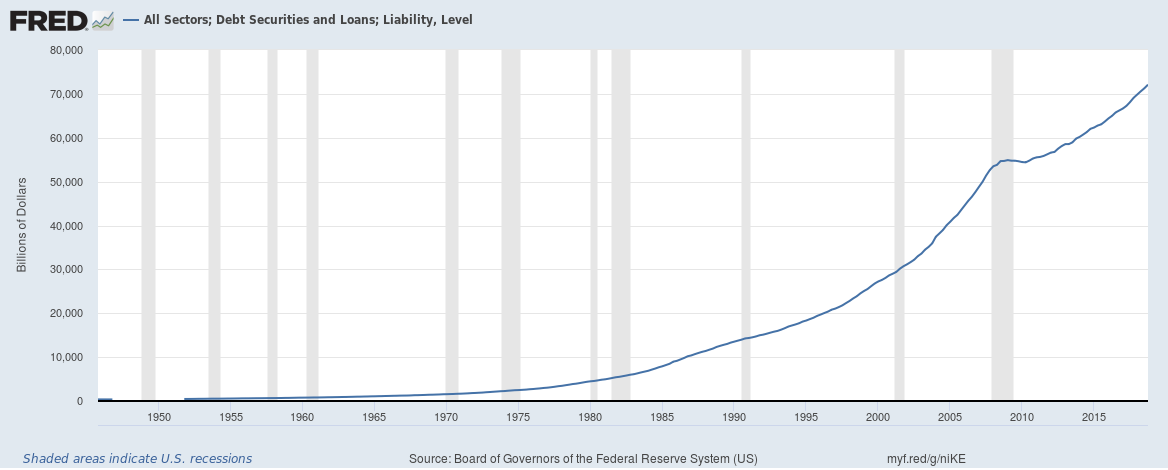
In absolute terms the total credit market or total debt outstanding of the U.S. which includes debt owed by the government (Federal and local), corporations and households stands at $72 trillion.
Continue reading “How big really is the total debt of the United States?”
Is Household Debt in the U.S. really a bigger problem than before the financial crisis?
There are various ways to look at Household Debt (total debt outstanding including mortgages, loans, credit cards and other debt) in the United States, we look at two today.
The first is debt servicing costs to disposable income which effectively is how much it costs to service household debt as a fraction of disposable (after tax) income. The second is household debt outstanding to disposable income which effectively is how much debt there is with respect to the same disposable (after tax) income measure.
Delinquency and Charge-off rates across banks in the United States remain low (January 2019 edition)
We answered the question whether bad loans were really increasing for banks in the United States at the end of December. We look at Delinquency and Charge-off rates across banks for United States across different products in this post.
UK household credit growth remains robust despite Brexit as outstanding household debt hits 80% of GDP
Household credit growth has been slowing around most of the world including the United States, Canada and Australia but remains robust in the United Kingdom despite economic concerns around Brexit. Household debt excluding student loans has hit 80% of GDP and including student loans has hit 90% of GDP.
European Union Statistics for Total Debt to GDP, Banking Non-Performing Loans and Loan to Deposit Ratio
European Union Debt to GDP
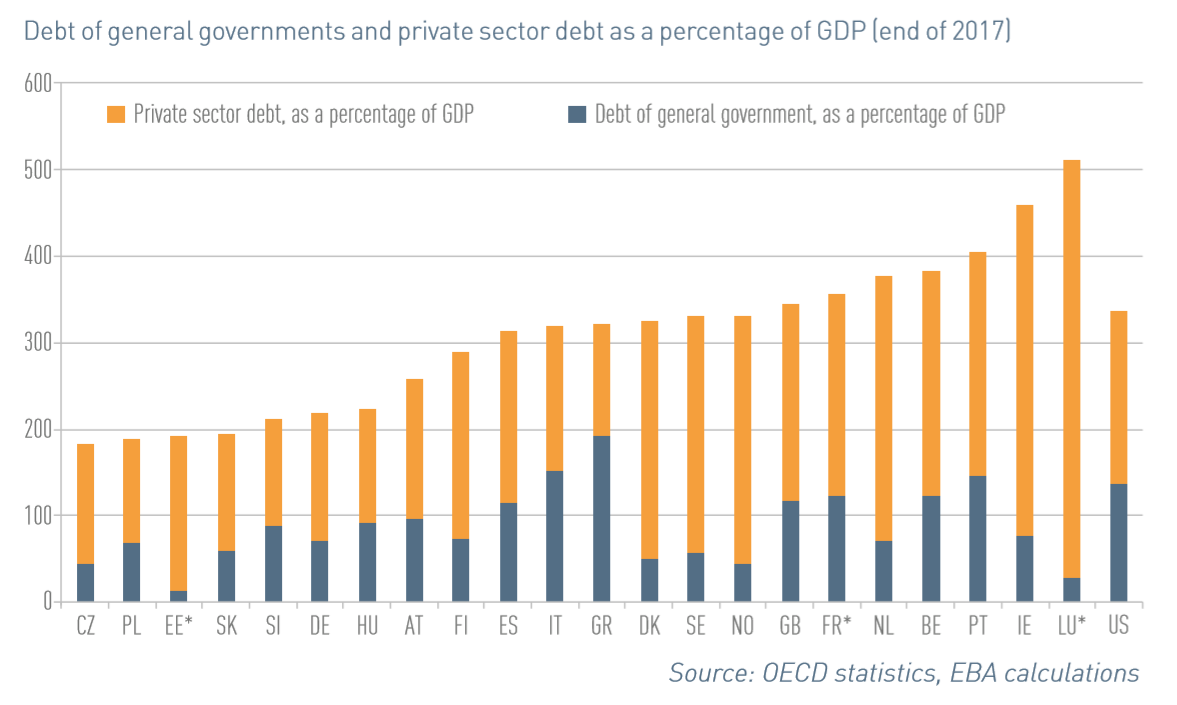
European Union total debt (Debt of general governments and the private sector) as percentage of GDP is now over 300%. Ireland’s total debt to GDP is an eye watering 450%. A decade ago the EU total debt to GDP was 180%, the debt bubble is well and truly here.
The UK just changed the way they account for student loans which means the UK will likely have a fiscal deficit at least until the 2040s
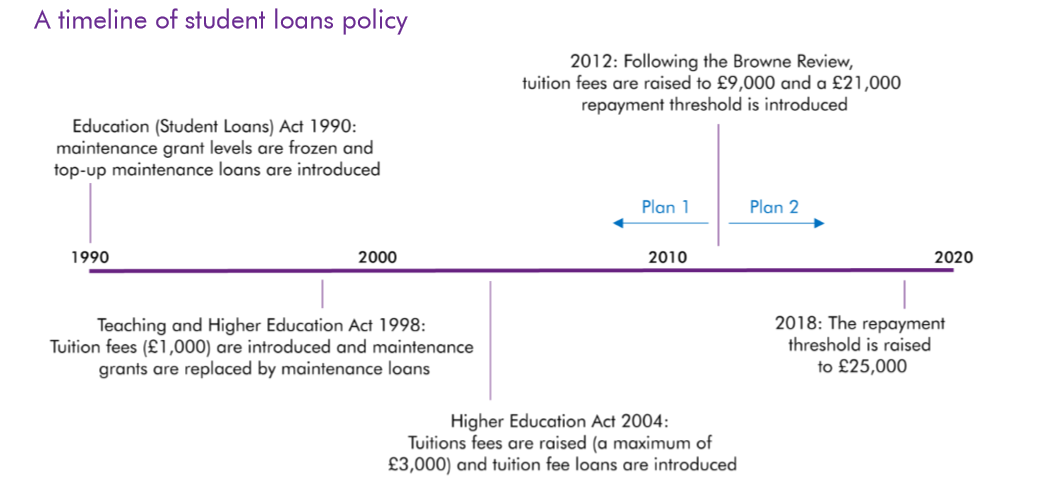
The UK’s higher education funding system is unique in many ways and a change today is quite significant in terms of fiscal accounting. Firstly, here’s a timeline of the student loan system in the UK.
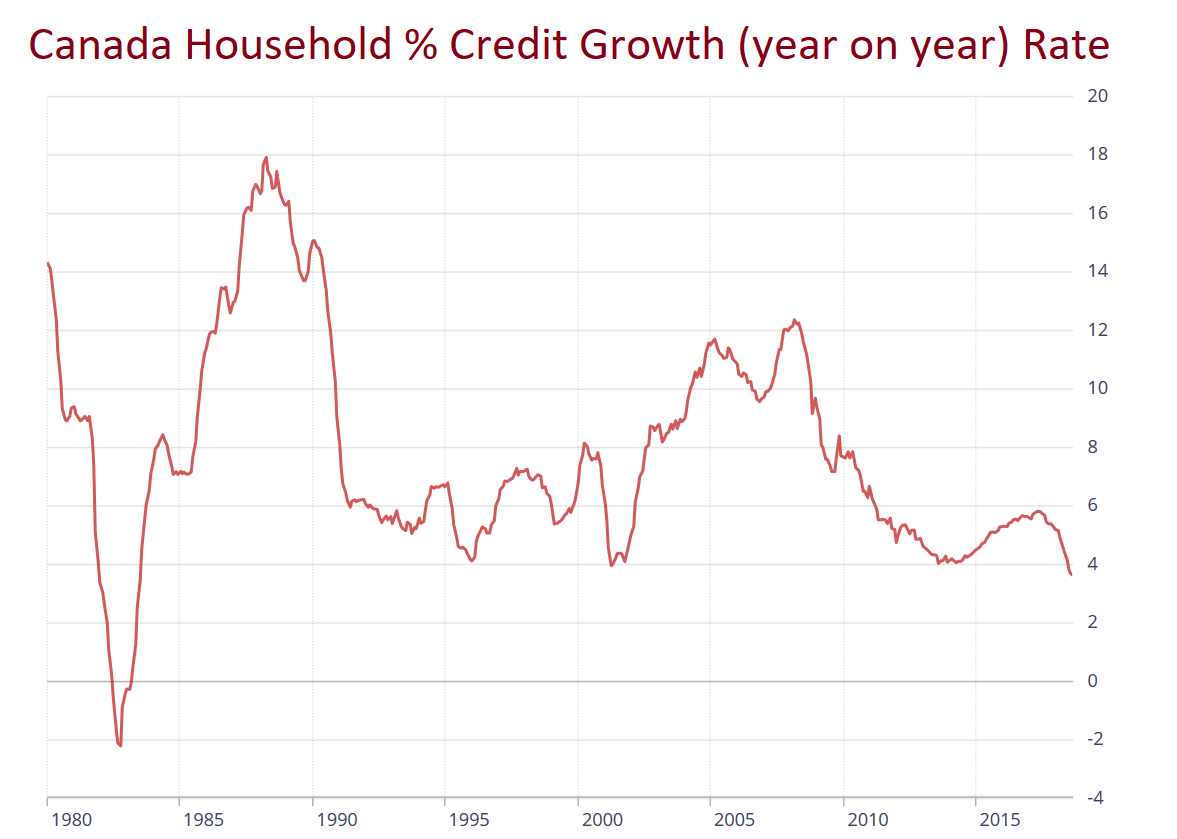
Household credit growth in Canada is slowest in 35 years but outstanding household debt stands at over 125% of GDP and individual debt is already 175% of disposable income
Households in Canada are accumulating debt at the slowest pace in 35 years as interest rates continue to rise. Household credit growth has slowed to 3.5%, the slowest since 1983.
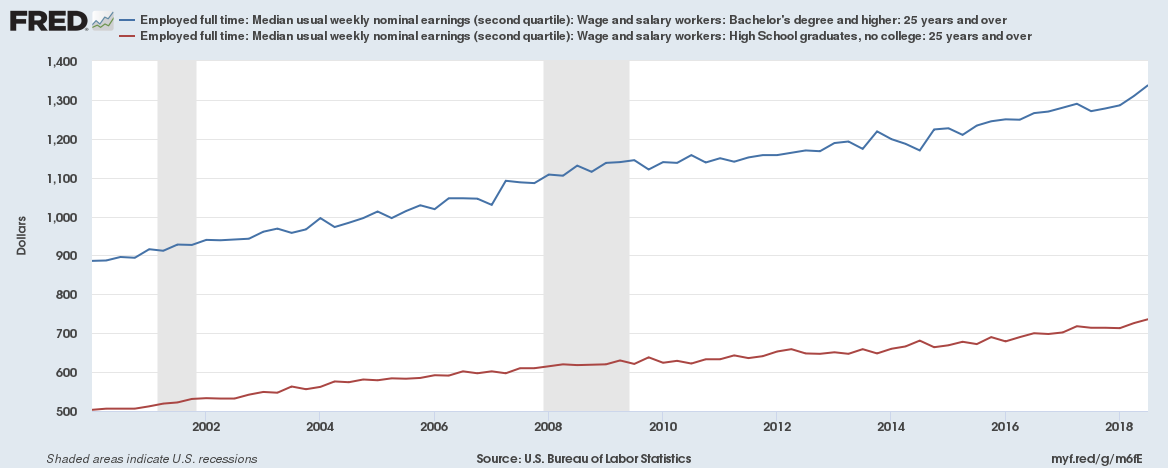
U.S. student debt outstanding now stands at $1.56 trillion but growth is slowest ever; Is university education value for money?
U.S. student debt outstanding now stands at a record $1.56 trillion, almost doubling in the past 8 years.
Government debt to GDP down to 86.3% in the Euro area (Eurozone) and down to 81% in the European Union
At the end of the second quarter of 2018, the government debt to GDP ratio in the Euro area (EA19) or Eurozone stood at 86.3% and in the European Union (EU28) the ratio stood at 81%.
