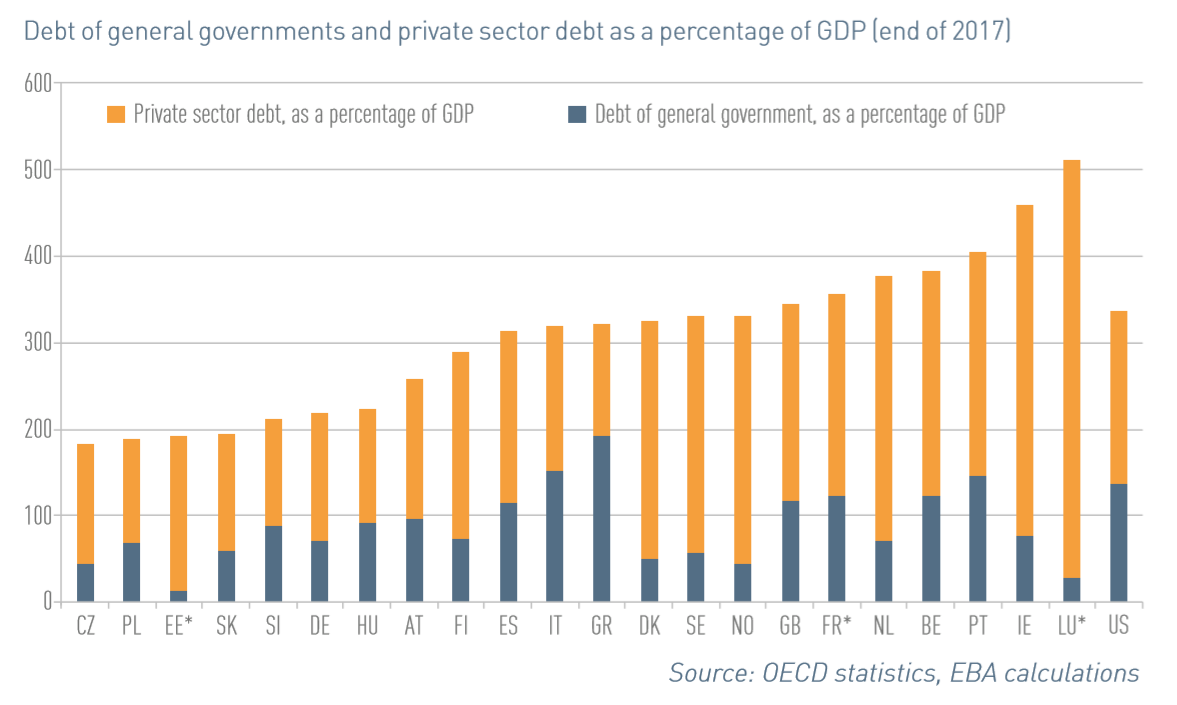
European Union Debt to GDP
European Union total debt (Debt of general governments and the private sector) as percentage of GDP is now over 300%. Ireland’s total debt to GDP is an eye watering 450%. A decade ago the EU total debt to GDP was 180%, the debt bubble is well and truly here.
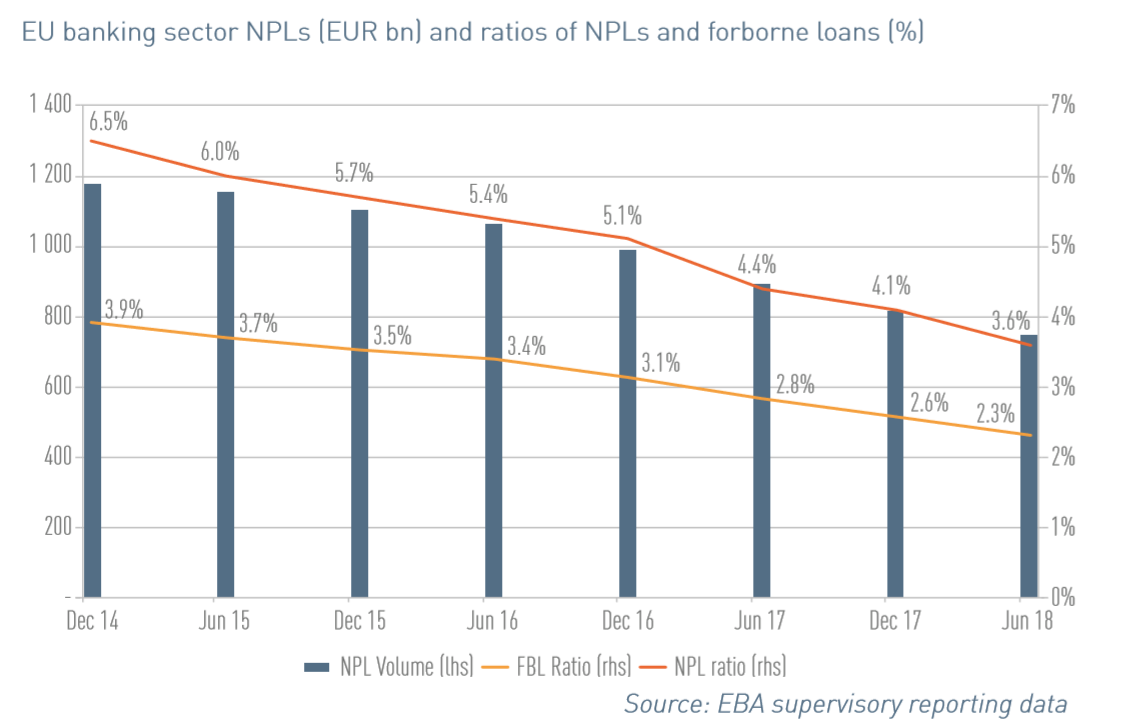
Banking Non-Performing Loans (NPLs)
At the end of Q2 2018, the gross carrying amount of NPLs in the EU was €746 billion, which corresponded to an NPL ratio of 3.6%. Although the EU NPL ratio has improved notably since December 2014 it remains elevated compared with other regions: the NPL ratios for Japan and the U.S. are only 1.2% and 1.1%, respectively. Forbearance loans – which are loans where there is an agreement to delay payments or a payment holiday stand at 2.3% of all loans. Forbearance loans are different from NPLs, they don’t form part of NPLs.
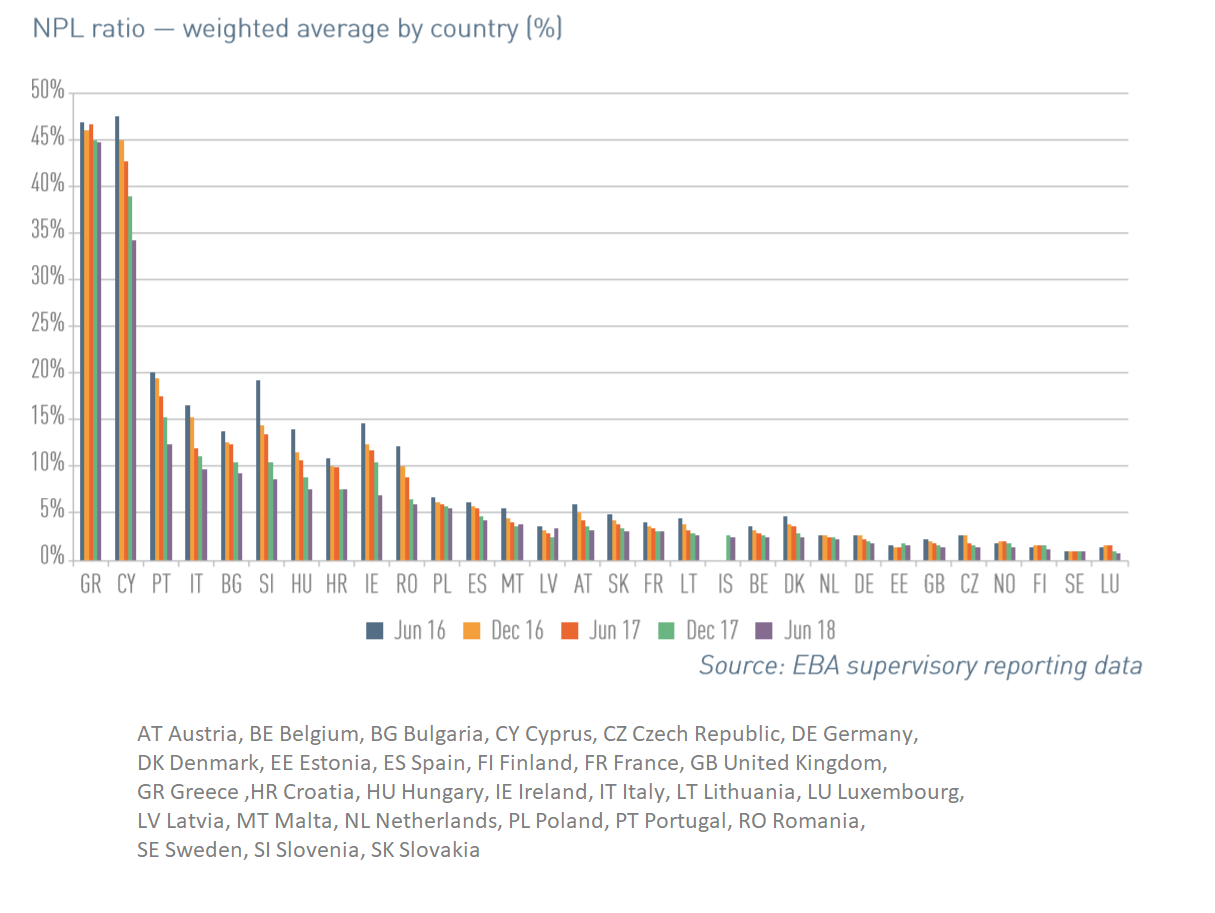
Banks in Greece and Cyprus have bad loans of over 40% a decade on from the financial crisis.
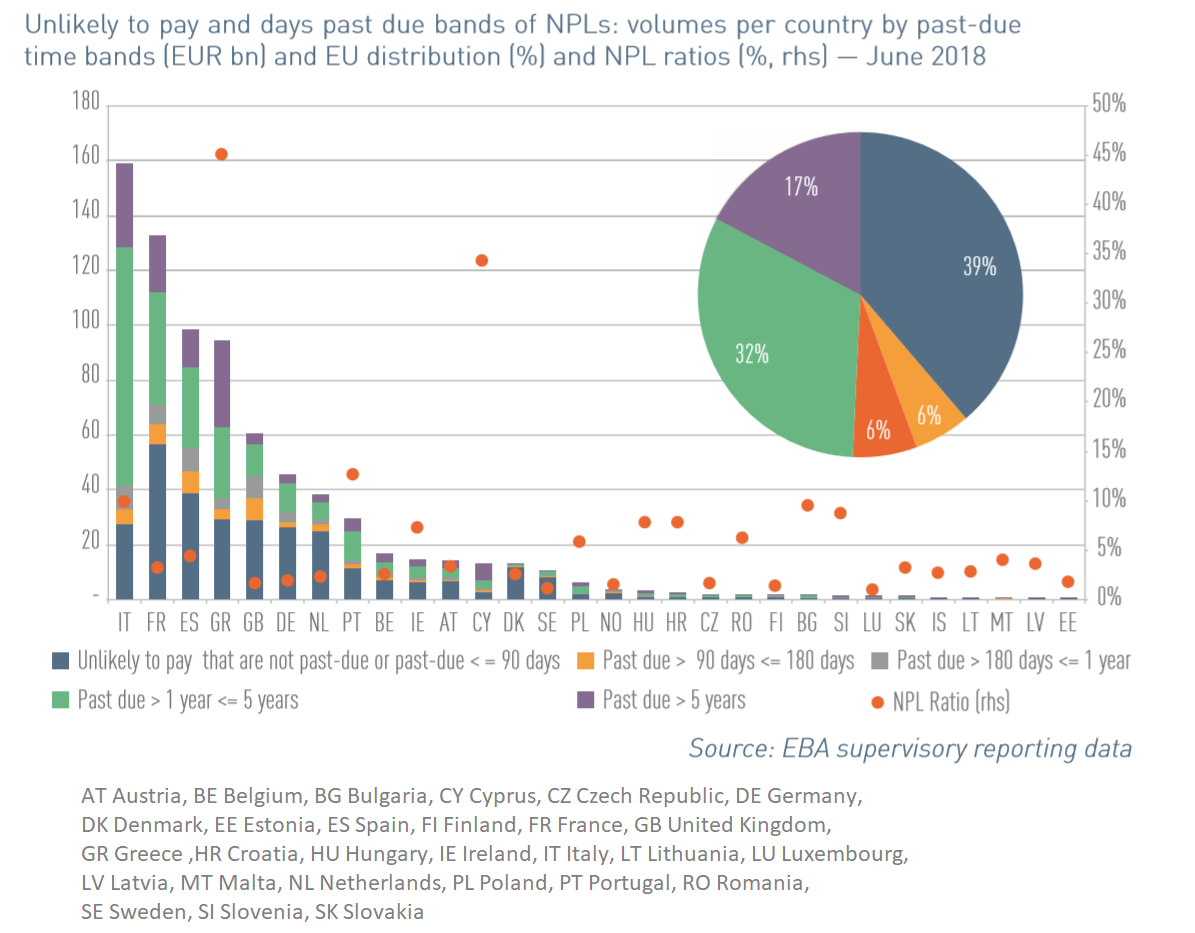
Italian banks have around €160 billion of bad loans followed French banks at €130 billion.
Loan to Deposit Ratio
The loan to deposit ratio for EU banks stands at 1.16 or 116%. How do EU banks lend more than their deposit base? They borrow from other financial institutions (including their Central Bank). The ratio is around 0.77 for the U.S. (Related: Banks in the United States have a problem – they can’t find enough customers to lend money to).

The European Union (EU) currently includes Belgium, Bulgaria, the Czech Republic, Denmark, Germany, Estonia, Ireland, Greece, Spain, France, Croatia, Italy, Cyprus, Latvia, Lithuania, Luxembourg, Hungary, Malta, the Netherlands, Austria, Poland, Portugal, Romania, Slovenia, Slovakia, Finland, Sweden and the United Kingdom.
Related:
Past, present, future – some demographic and economic statistics for the European Union