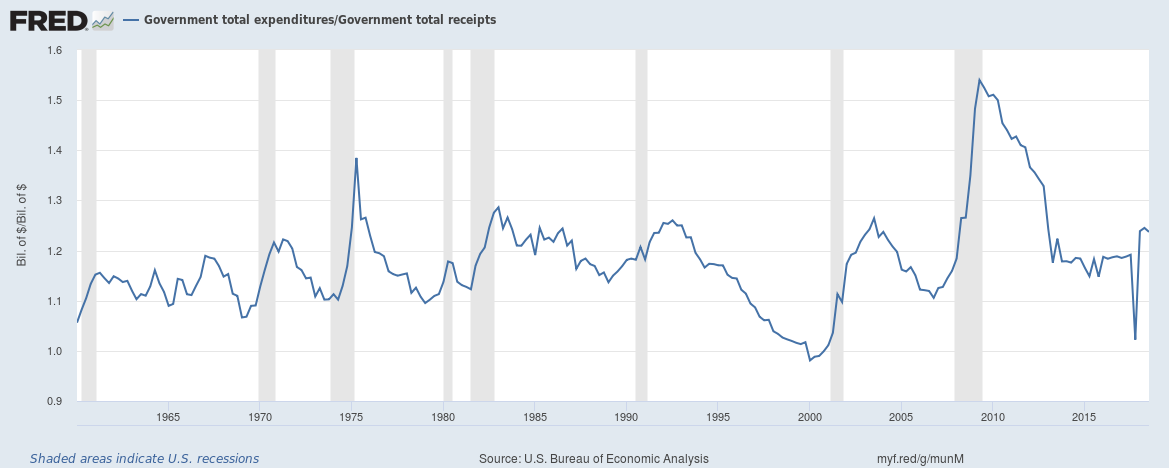
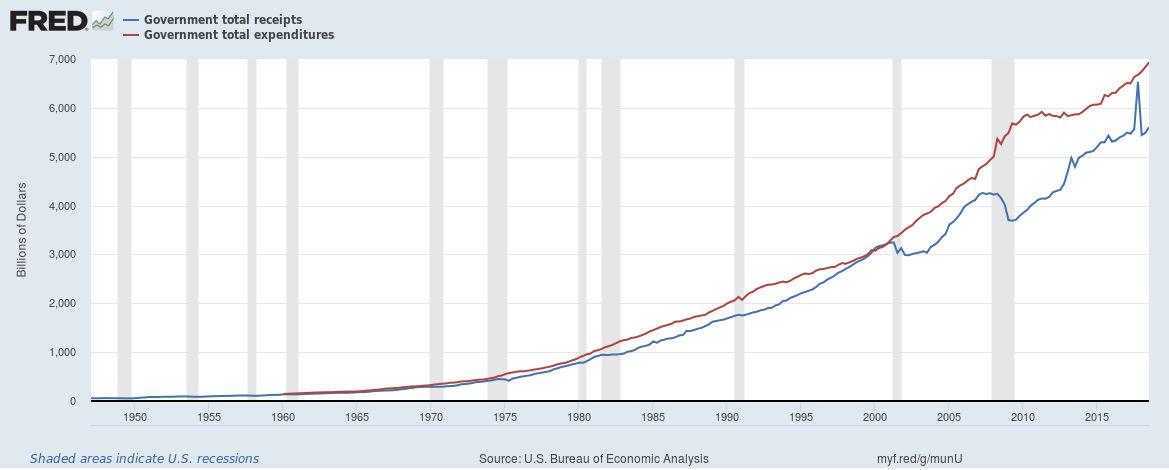
The fiscal situation in the United States is worsening as government debt piles up. The U.S. government (Federal, state and local combined) now spends $1.24 for every $1 in income.
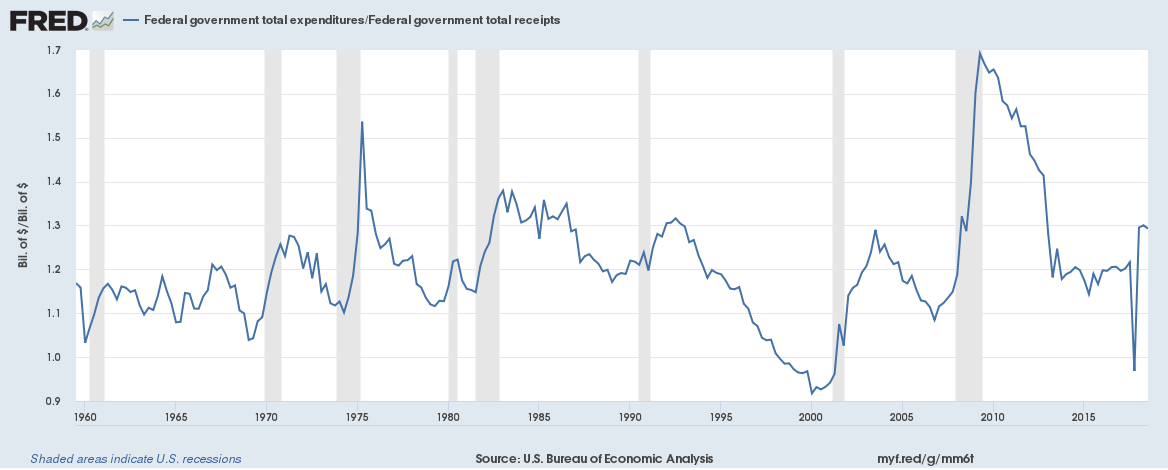
The Federal government expenditure to receipts ratio is worse at 1.29 which mean the U.S. Federal government spends $1.29 for every $1 in income.
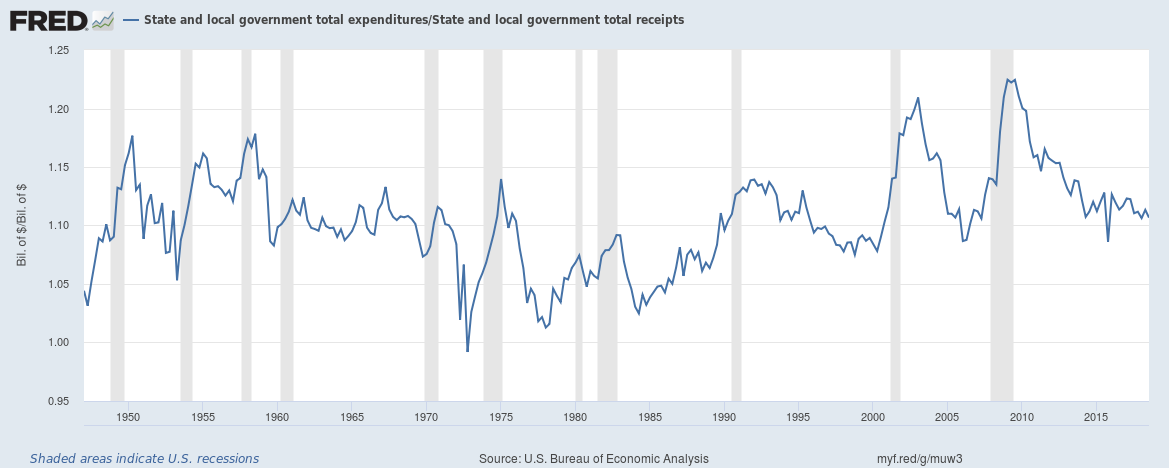
The situation for State and local governments is slightly better with $1.11 in expenditure for every $1 in income.
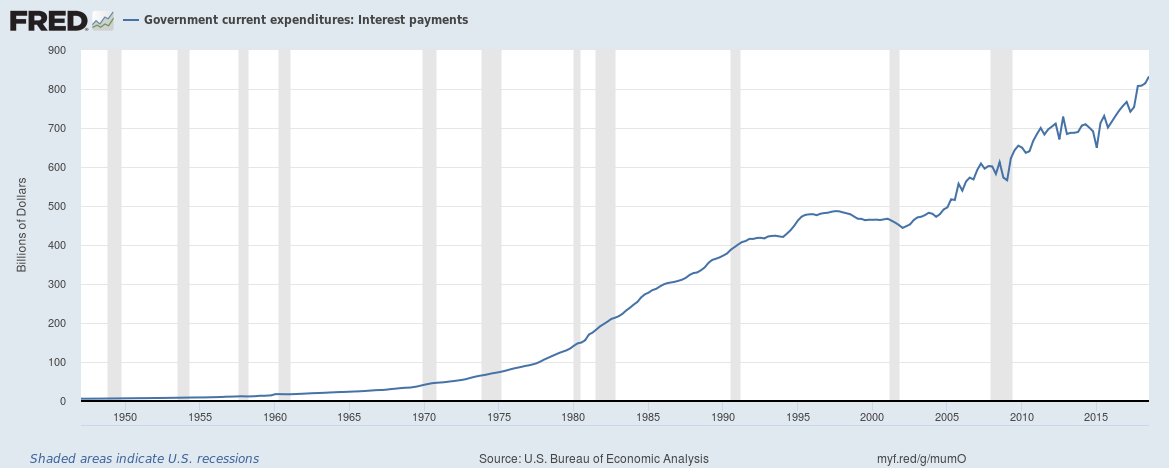
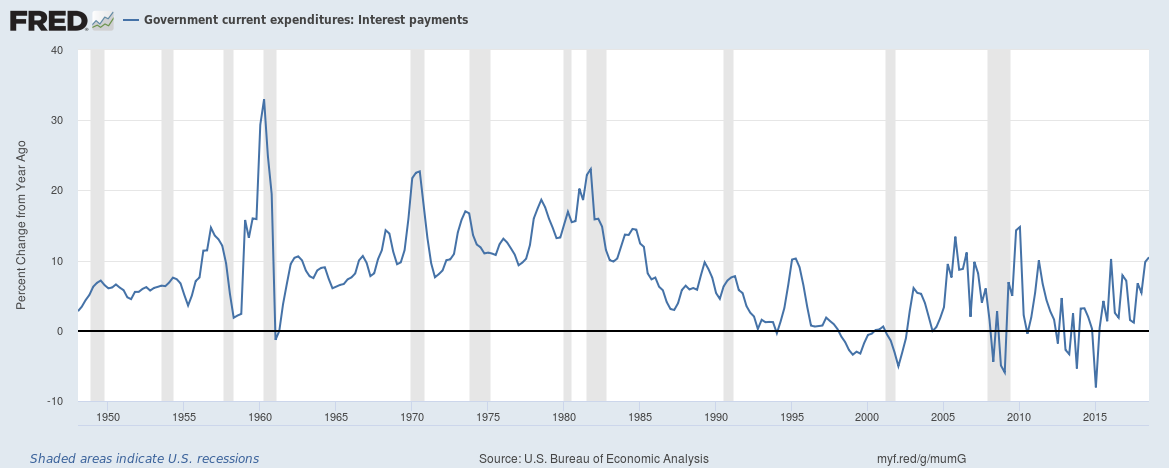
The total interest spend for the U.S. government (Federal, state and local combined) now stands at an annualized $832 billion and is growing at around 10.6% annually. Interest payments are rising due to growing debt and rising interest rates on new bond issuances by the government.
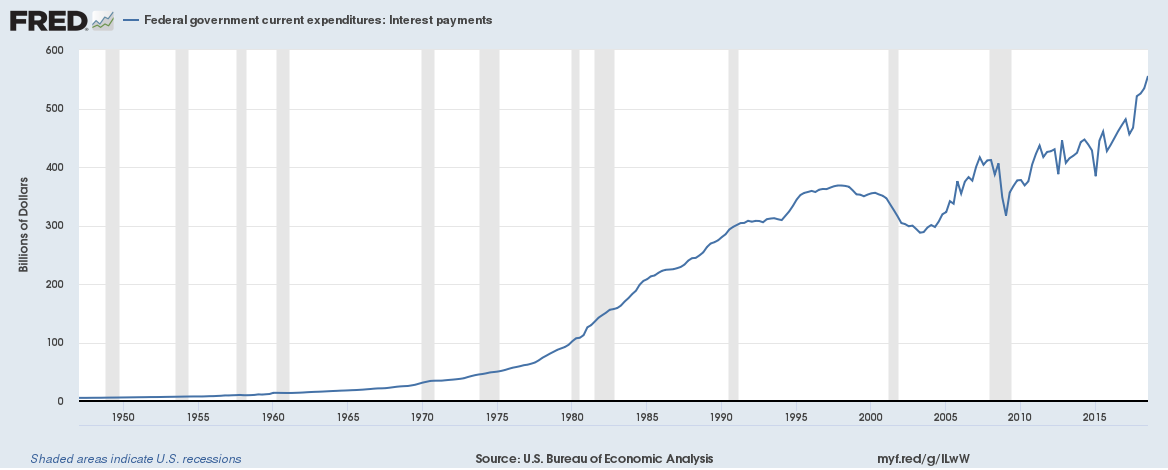
Federal government interest payments are soaring, with annualized interest payments now running at $555.58 billion.
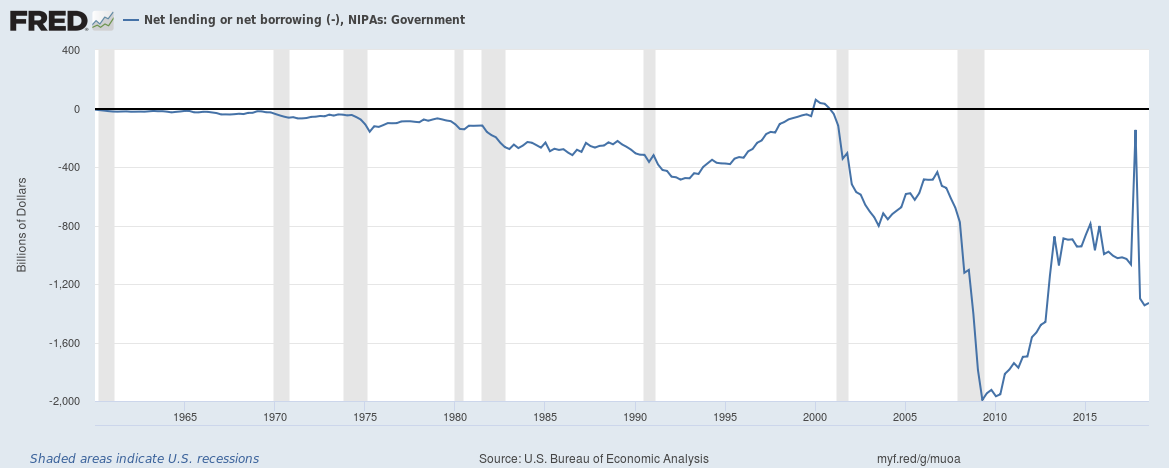
Government net borrowing (Federal, state and local combined) is expected to be around $1.33 trillion this year. The last time the there was a budgetary surplus was in 2001.
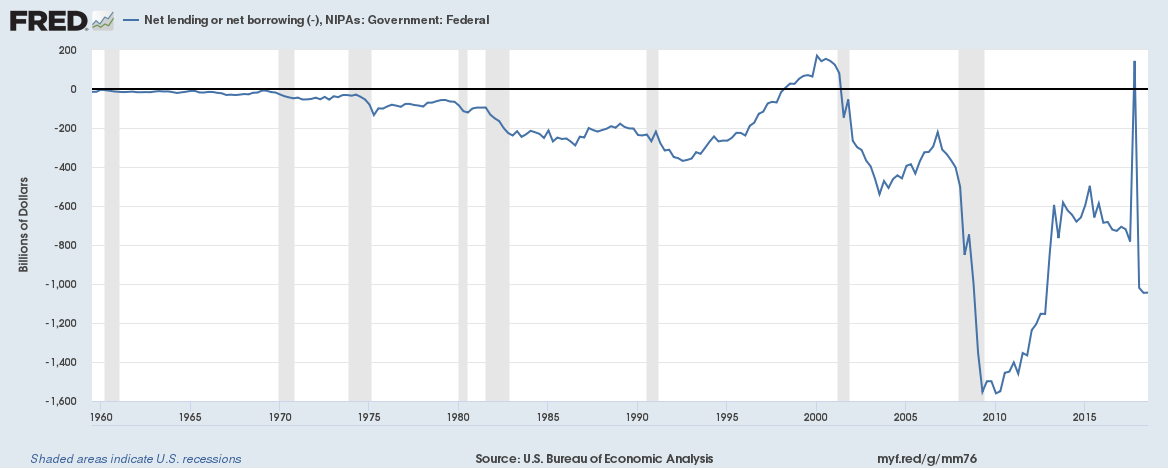
Federal government net borrowing is expected to be $1.04 trillion this year,
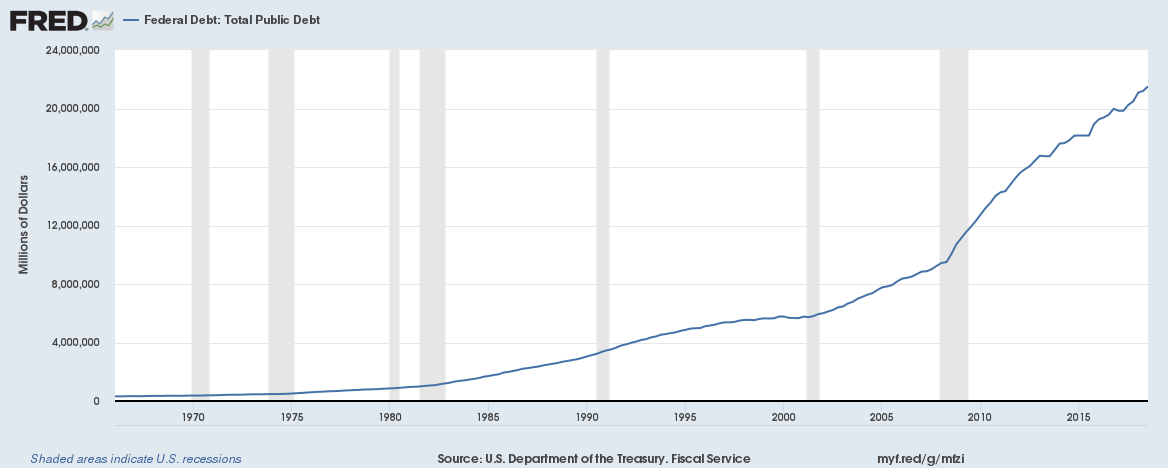
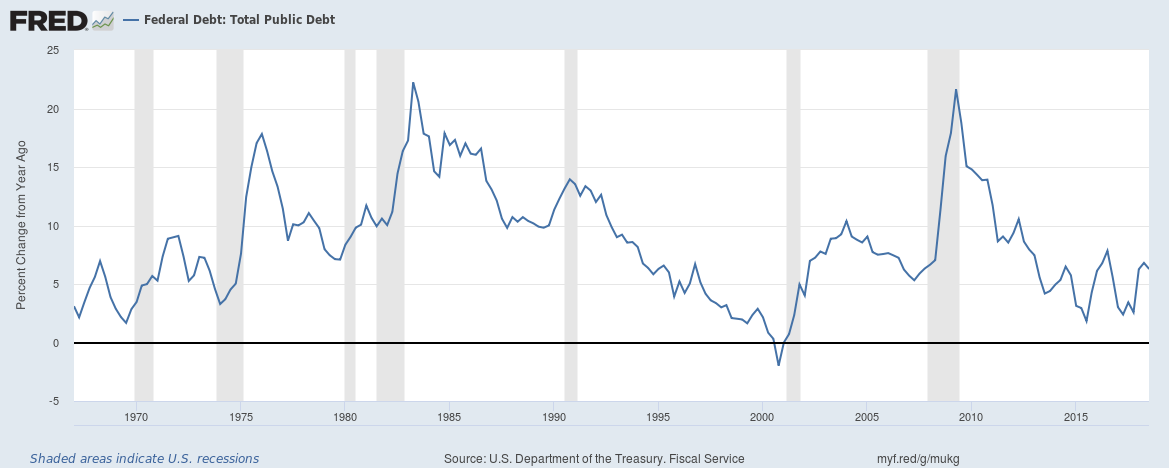
Federal government debt outstanding now stands at $21.52 trillion,
Expenditure is growing far quicker than income which is mainly down to tax cuts,
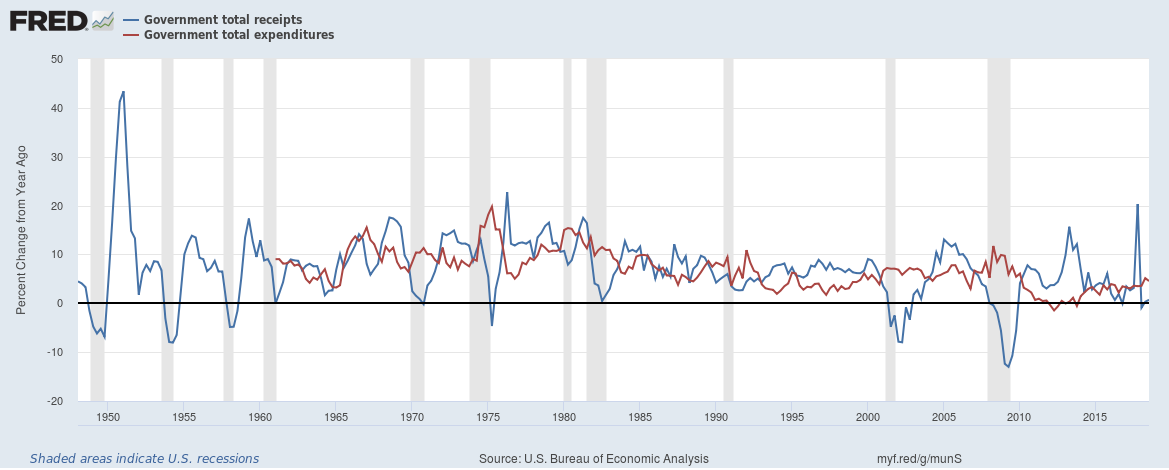
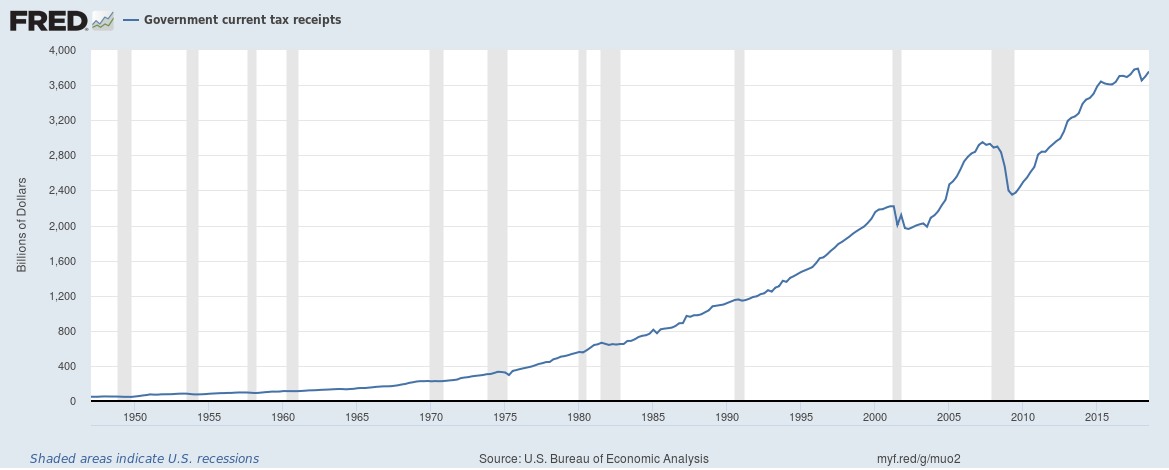
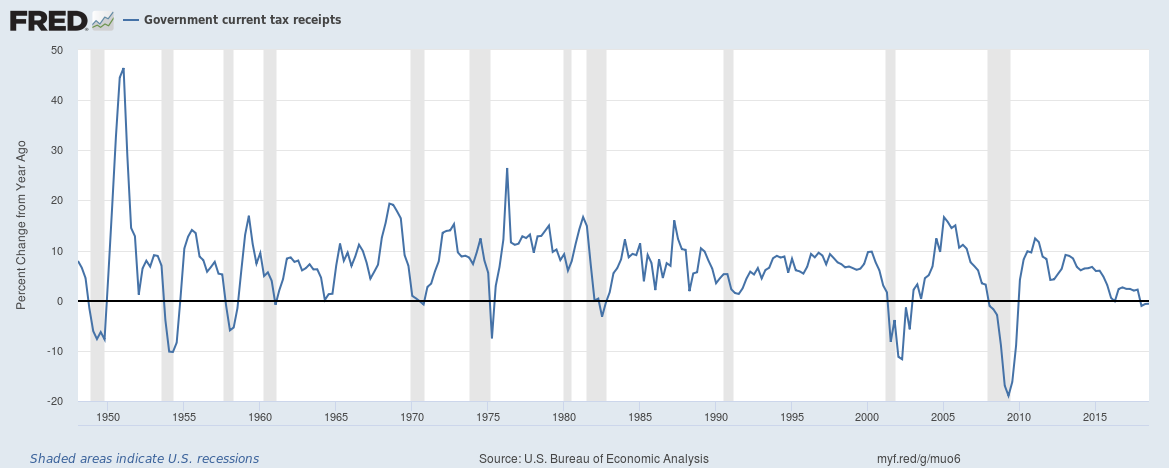
Tax revenues have fallen 0.6% year on year. Tax revenues are almost 68% of all government income.
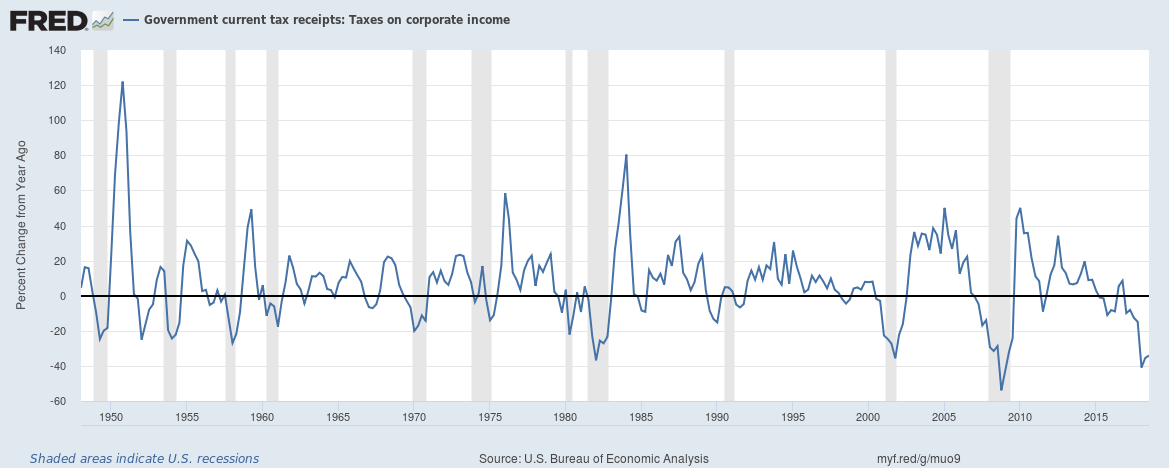
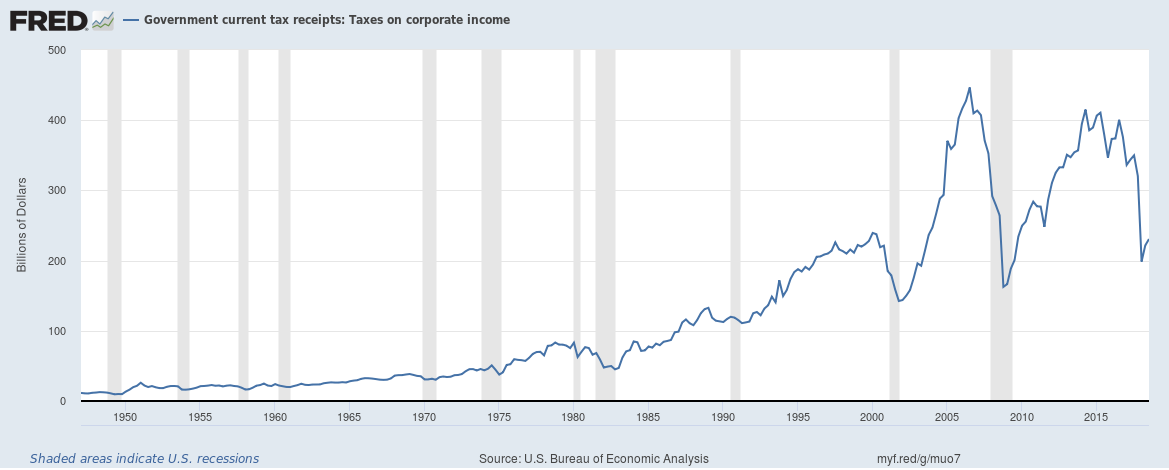
Corporate tax collections have fallen (due to tax cuts) by 35%,
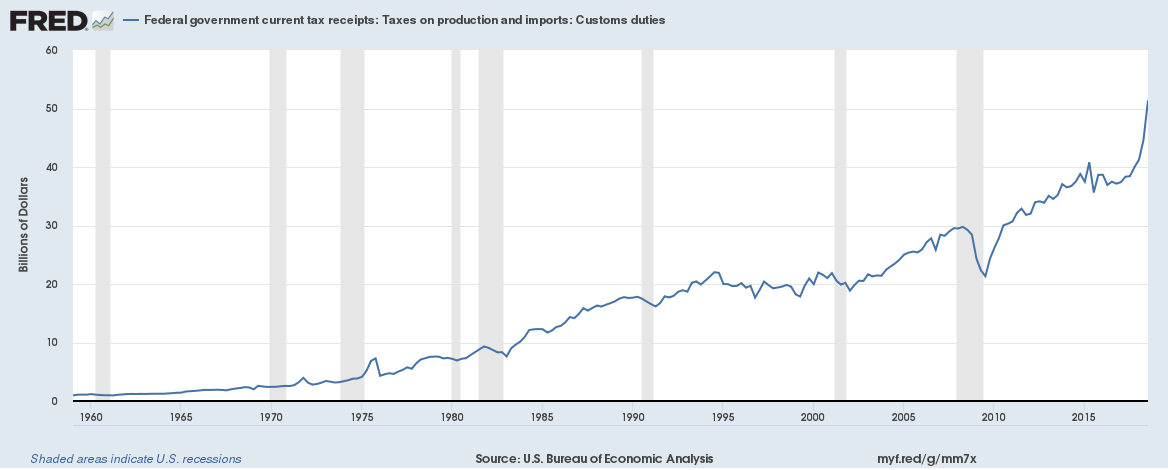
Custom duties though are at the highest level ever due to trade tariffs,
The U.S. is only amongst a handful of countries left with a AAA rating. If the U.S. was a corporation (rather than a country/government) with persistent borrowing, ever increasing debt, expenditure running at a pace quicker than income in an environment of rising interest payments (and rates) and with very high senior management turnover it would probably be rated quite badly by the rating agencies.
Related:
The curious case of low U.S. money velocity
Don’t rule out high or hyper inflation in the road ahead
The Federal Reserve is unwinding its balance sheet, here’s why and how it is doing it
Can the US government really cope with rising bond yields?
Banks in the United States have a problem – they can’t find enough customers to lend money to
The yield curve inversion plus why banks and banking stocks are impacted by it