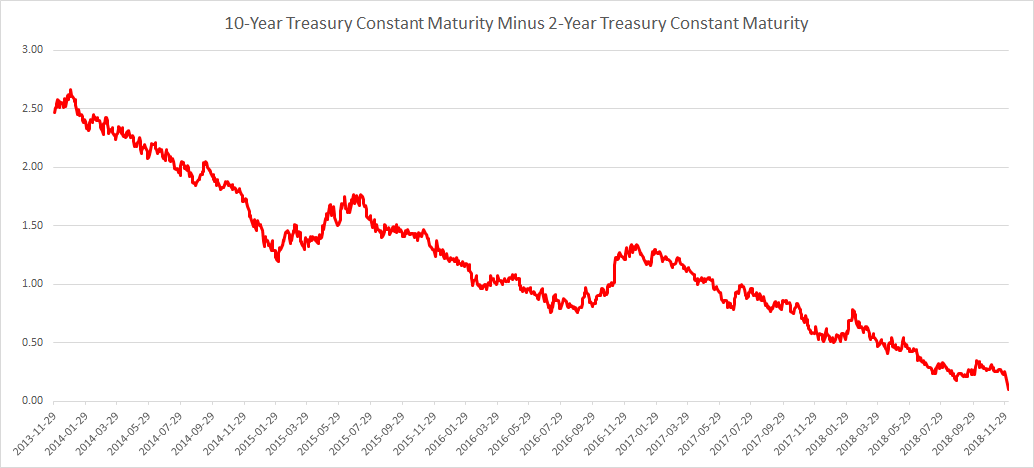
The U.S. 10-year Treasury constant maturity yield minus the 2-year Treasury constant maturity yield spread has been a good indicator of past recessions. Yield curve inversion which happens when the spread turns negative and has preceded the last seven straight recessions. The 10-year Treasury constant maturity yield minus the 2-year Treasury constant maturity yield is the lowest since the last recession at only 10 bps.
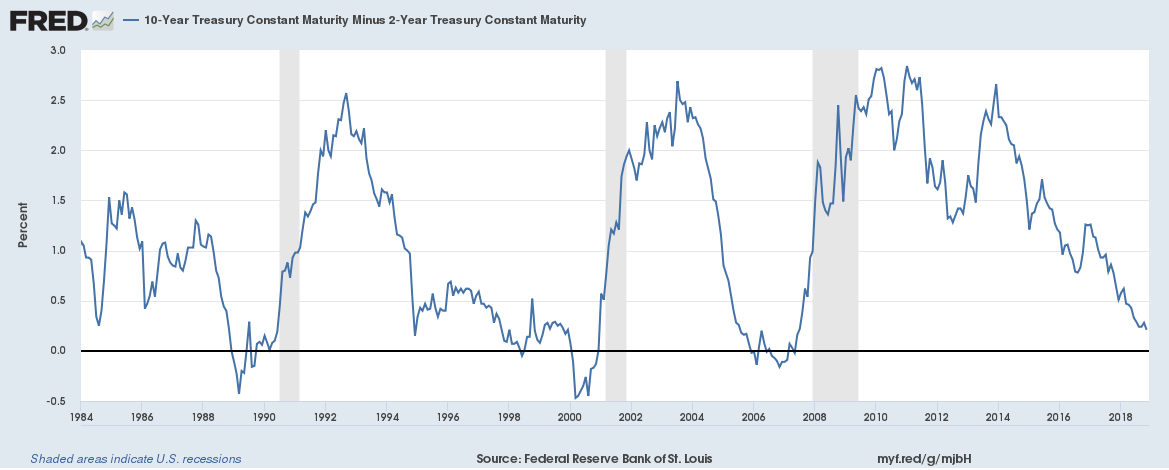
Here is a longer time period chart,
The impact on banks
Banks lend on interest rates based on longer-term yields and pay interest on deposits based on shorter-term yields. A bigger yield spread between long-term and short-term yields means greater profits. When the yield curve falls so do profits. And lower profits equate to lower stock prices.
The yield curve is one of our three U.S. recession indicators. (Related: Those three U.S. recession indicators – how near or far are those from being invoked? September 2018 edition)