We couldn’t find any official Money Velocity numbers for the United Kingdom so calculated it using the Equation of Exchange.
Equation of Exchange
MV=PQ
Money Supply (M) * Money Velocity (V) = Price level (P) * Real economic output (Q)
Which means Money Supply * Money Velocity = Nominal GDP
Therefore, Money Velocity = Nominal GDP/Money Supply
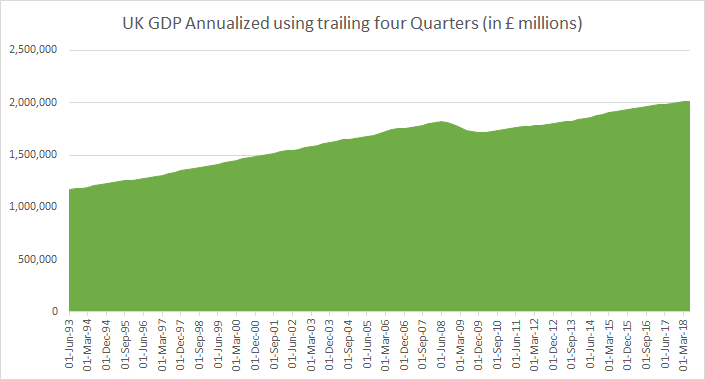
We have the numbers for both Money Supply (from the Bank of England) and Nominal GDP (from the Office for National Statistics) for the UK.
Money Velocity
The velocity of money is the frequency at which one unit of currency is used to purchase domestically-produced goods and services within a given time period. In other words, it is the number of times one British Pound is spent to buy goods and services per unit of time. If the velocity of money is increasing, then more transactions are occurring between individuals in an economy.
The frequency of currency exchange can be used to determine the velocity of a given component of the money supply, providing some insight into whether consumers and businesses are saving or spending their money.
Money Supply or Money Stock (we have considered M3)
Broad Money M3: Broad money (M3) includes currency, deposits with an agreed maturity of up to two years, deposits redeemable at notice of up to three months and repurchase agreements, money market fund shares/units and debt securities up to two years.
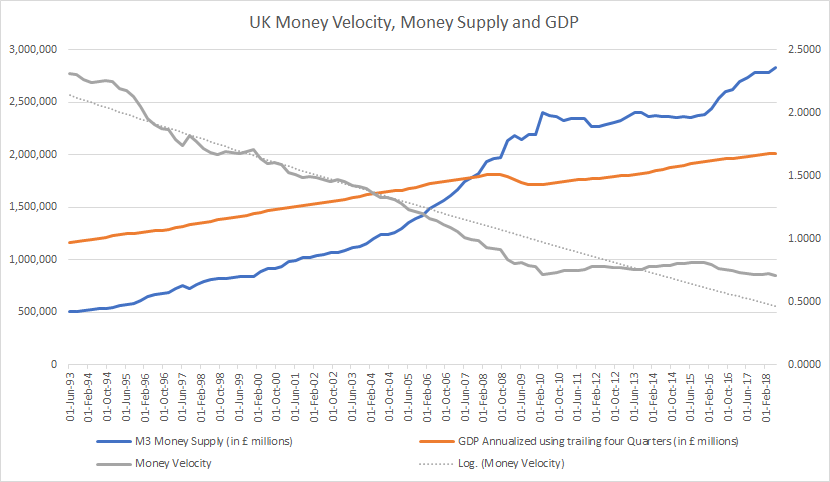
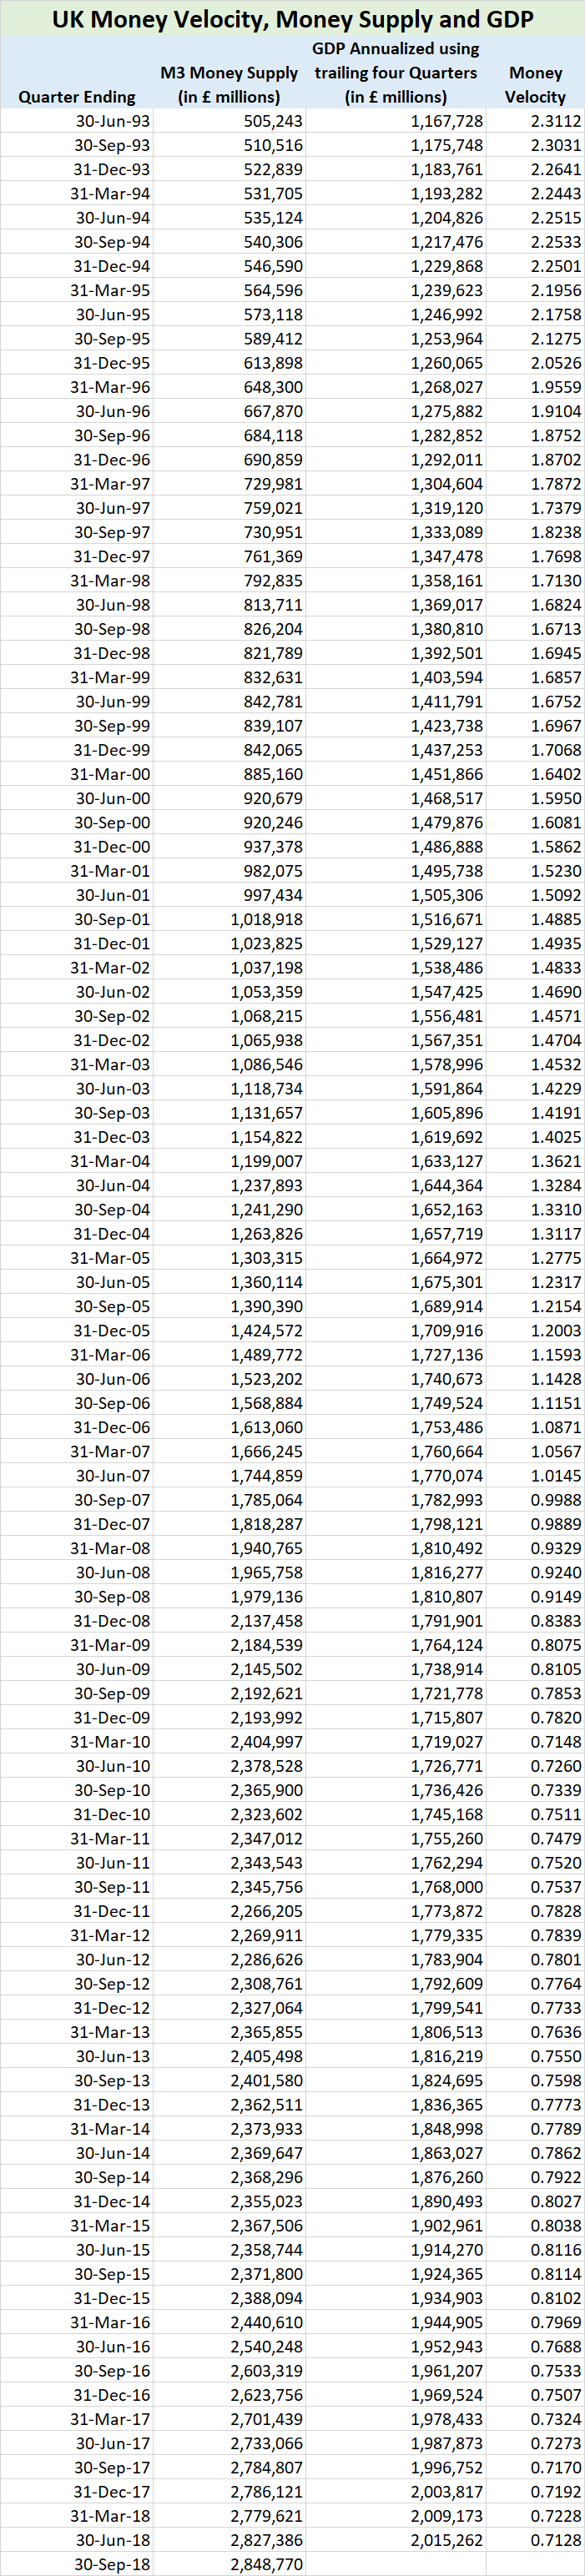
M3 Money Velocity for the United Kingdom
Here is a graph of M3 Money Velocity for the United Kingdom (the complete data set is at the end of this post, please contact us if you would like the data in a spreadsheet),
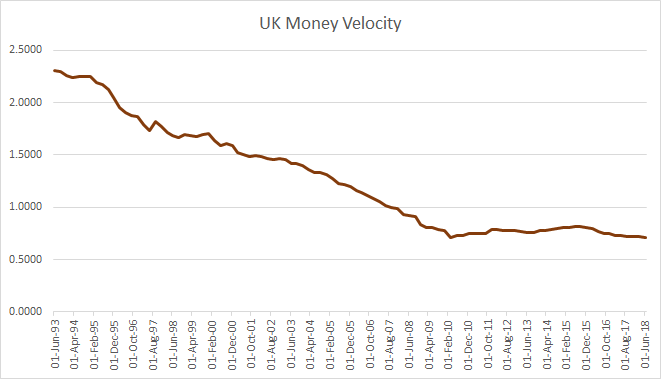
Money velocity in the United Kingdom is currently less than 1 which means that money being printed (even notionally) isn’t even circulating once. It has fallen significantly this century, it has started increasing as GDP growth is accelerating and Money Supply growth is decelerating. The complete data set is at the end of this post, please contact us if you would like the data in a spreadsheet.
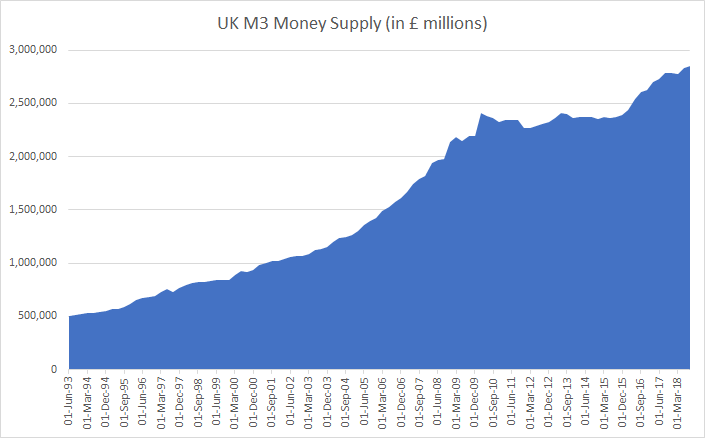
M3 Money Stock or Money Supply for the United Kingdom is bigger than the GDP of the United Kingdom and stands at a record of £2.85 trillion (at the end of September 2018).
Given that money velocity is so low now implies
1. Consumer and business confidence for spending isn’t particularly high.
2. Consumers and businesses aren’t borrowing too much money either.
3. There is ample (probably excessive) liquidity in the system.
For the United Kingdom it would appear that years of Quantitative Easing has caused too much liquidity which in turn has caused money velocity to fall significantly.
Related (Money Velocity):
The curious case of low U.S. money velocity
Euro Area or Eurozone Money Velocity seems to be shockingly low
Here’s how Australian Money Velocity has changed over the years
Here’s how much money supply has grown for major economies in the past decade (2008 to 2018)
Related (United Kingdom):
The UK economy a decade on from the 2008 recession
The Bank of England Balance sheet has been expanding rather quickly recently
The UK’s net worth is now estimated at £10.2 trillion, an average of £155000 per person
UK households have seen their outgoings surpass their income for the first time in nearly 30 years
Here’s how UK tax collections for different taxes have grown since the year 2000
Impact of (potentially) higher interest rates on households in the UK
Can the UK Government afford higher interest rates or rising bond yields?
Dataset for UK GDP, Money Supply and Money Velocity:
I shall be very grateful if you can send me the table of data related to money supply and velocity.
Can you tell me the source for the quarterly data?
We have emailed the data to you and have mentioned the data sources used.
Could you please send me the data source as well? I would like to source it for a report.
Thank you
We have emailed you the data as well as information about the data sources.
are you able to tell me how you calculated money velocity
Could you please send me the data sources?
Have you guys looked into taking this analysis further by breaking down the money supply as suggested by Prof Richard Werner’s Theory of Disaggregated Credit? The theory disaggregates the quantity theory of money underpinning your analysis by splitting money supply into supply for real economic activity that impacts the nominal gdp and supply for financial transactions which do not or have relatively little impact on gdp. I think it could be an interesting next step to take.
Prof Werner often found real velocity was constant, and that the reason why traditional measure of velocity was declining is because money supply increasingly goes to financial transactions, increasing the denominator, which have little impact on nominal gdp, numerator.