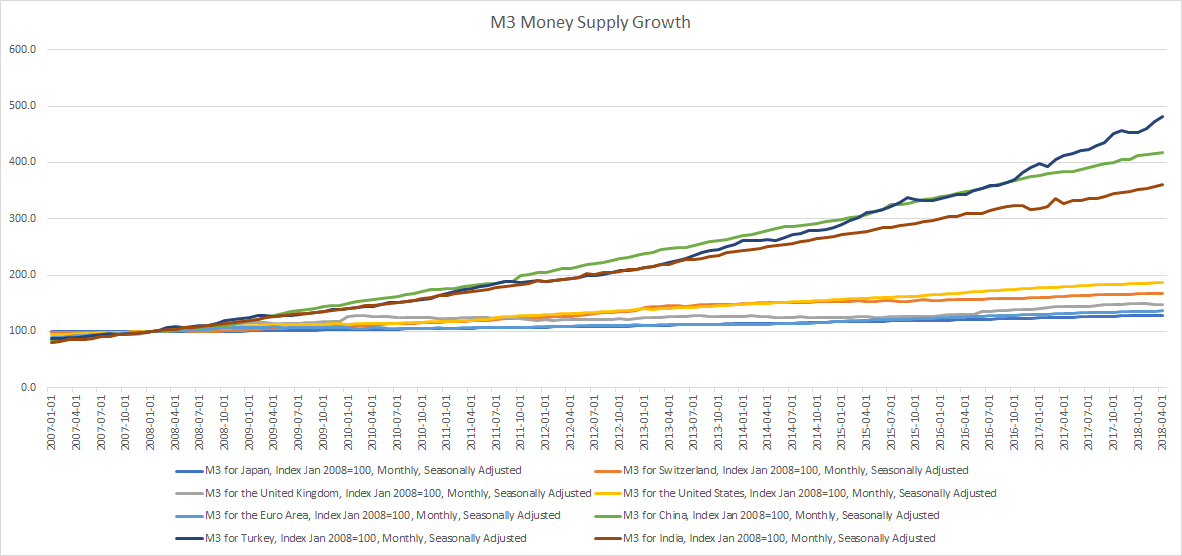
Here’s how much money supply has grown for major economies in the past decade (2008 to 2018)

Broad Money M3

Broad money (M3) includes currency, deposits with an agreed maturity of up to two years, deposits redeemable at notice of up to three months and repurchase agreements, money market fund shares/units and debt securities up to two years.

M3 Money Supply Growth Global
Source: Organization for Economic Co-operation and Development


Money Velocity

The velocity of M3 helps determine how often financial assets are switching hands within the economy.

The Equation of Exchange

MV=PQ

Money Supply (M) * Money Velocity (V) = Price level (P) * Real economic output (Q)

Alternatively, Money Supply * Money Velocity = Nominal GDP

Is Inflation as low as the official numbers claim it is or is money velocity super low? (Related: The curious case of low U.S. money velocity)

Here are charts for each country,
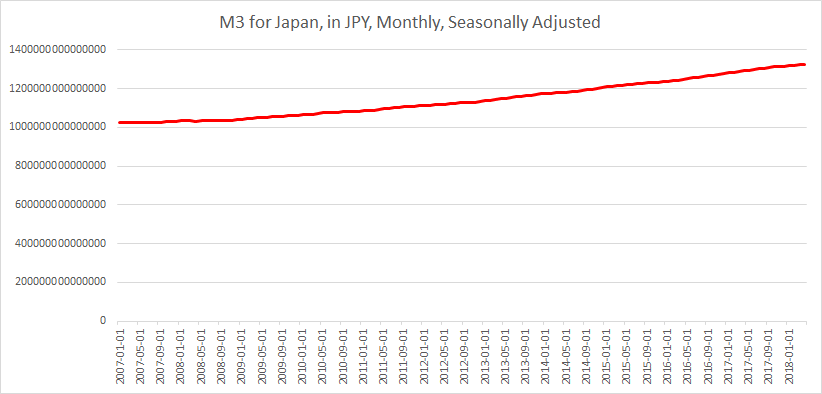
Japan
Growth since January 1, 2008: 28.4%
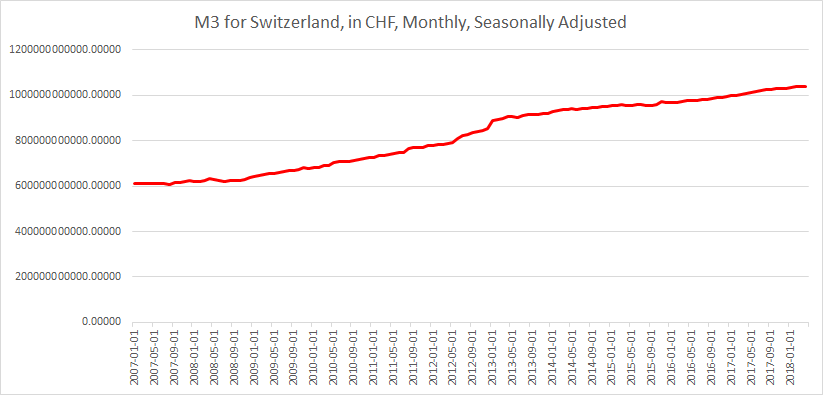
M3 Japan until May 2018
Source: Organization for Economic Co-operation and Development

Switzerland
Growth since January 1, 2008: 67.3%
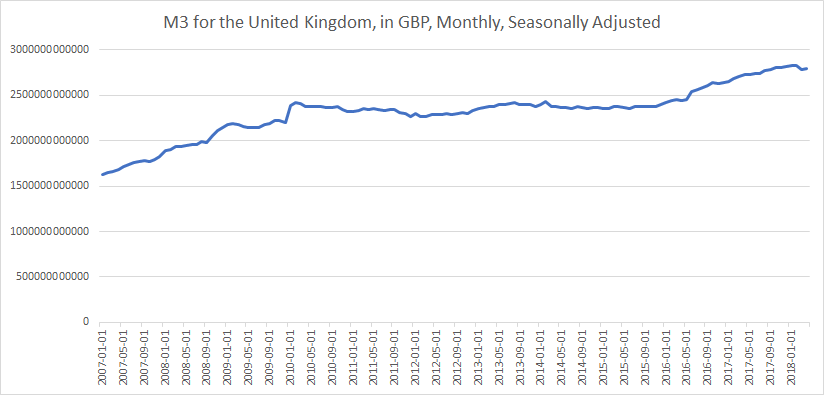
M3 Switzerland until May 2018
Source: Organization for Economic Co-operation and Development

United Kingdom
Growth since January 1, 2008: 48.2%
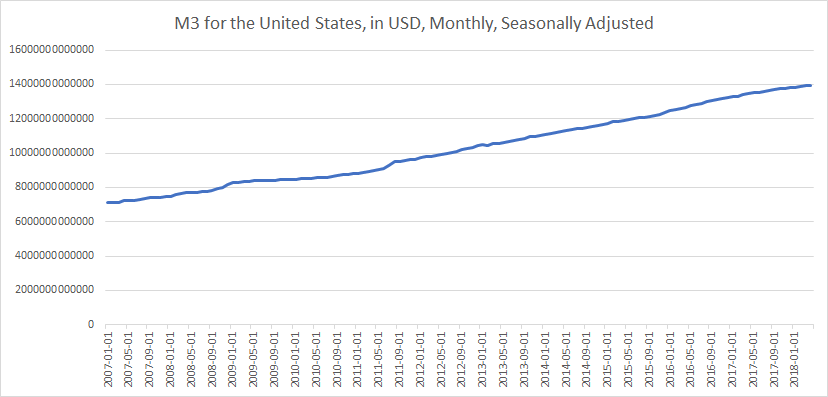
M3 United Kingdom until May 2018
Source: Organization for Economic Co-operation and Development

United States
Growth since January 1, 2008: 86.3%
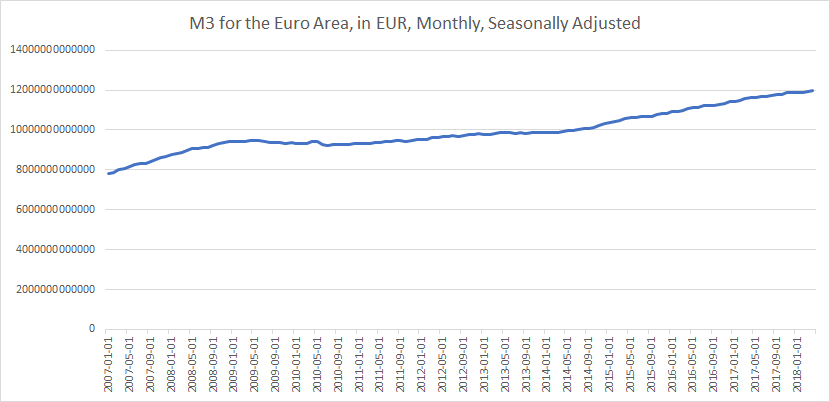
M3 United States until May 2018
Source: Organization for Economic Co-operation and Development

Euro Area
Growth since January 1, 2008: 36.5%
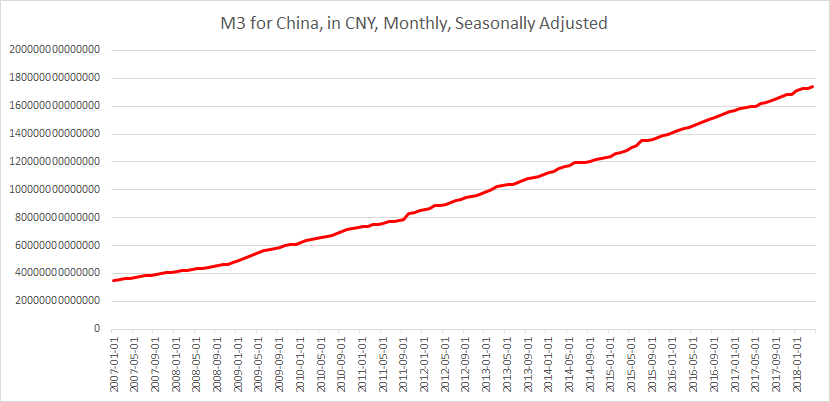
M3 Euro Area until May 2018
Source: Organization for Economic Co-operation and Development

China
Growth since January 1, 2008: 318.4%
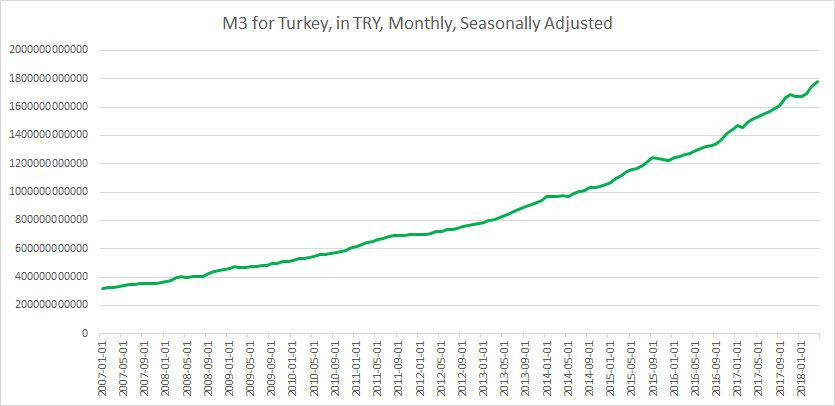
M3 China until May 2018
Source: Organization for Economic Co-operation and Development

Turkey
Growth since January 1, 2008: 381.8%
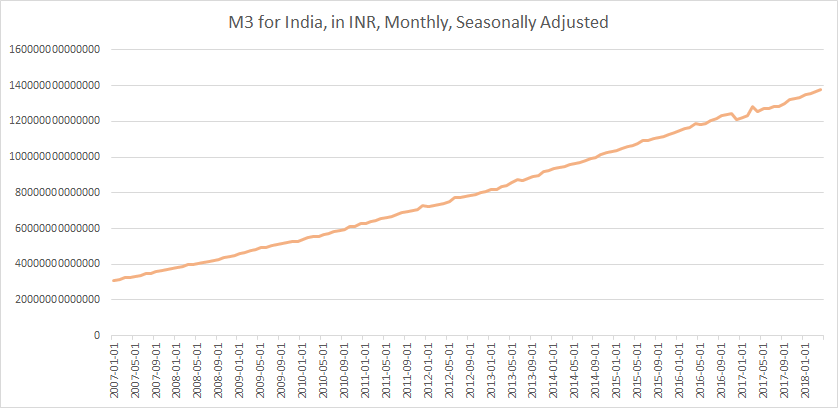
M3 Turkey until May 2018
Source: Organization for Economic Co-operation and Development

India
Growth since January 1, 2008: 260.4%

M3 India until May 2018
Source: Organization for Economic Co-operation and Development


Related:

Here’s how much the balance sheets of the Bank of Japan, the Swiss National Bank, the Federal Reserve and the European Central Bank have grown this century

Leave a Reply

Your email address will not be published. Required fields are marked *

This site uses Akismet to reduce spam. Learn how your comment data is processed.