The seasonally adjusted current account of the balance of payments for the European Union was a surplus of €40.5billion or 1% of GDP in the first quarter (Q1) of 2019, up from a surplus of €40.2billion or 1.0% of GDP in the fourth quarter (Q4) of 2018 and down from a surplus of €58.3billion or 1.5% of GDP in the first quarter (Q1) of 2018, according to estimates released by Eurostat.
UK’s trade deficit hit a record in Q1 2019 due to Brexit stockpiling
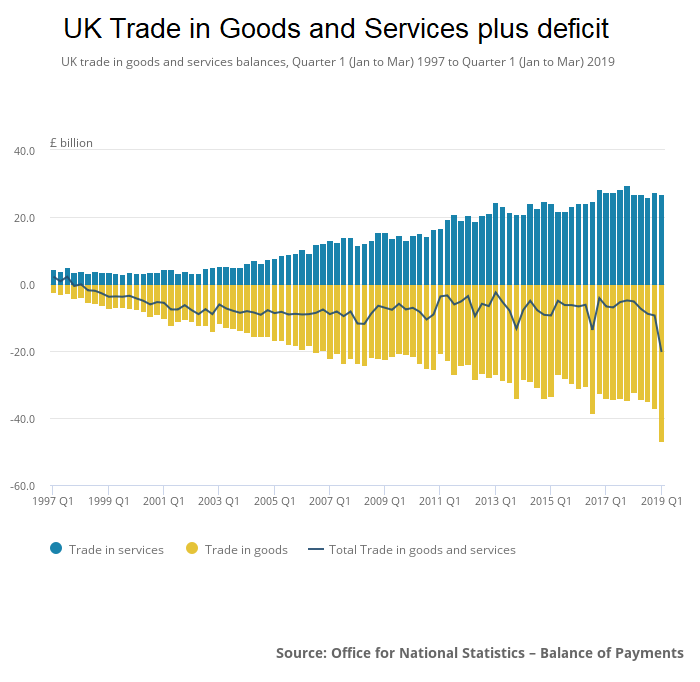
The United Kingdom’s trade deficit more than doubled to a record £20.3 billion in the first quarter (Q1) of 2019, or 3.7% of GDP. This was the fifth consecutive quarter of deterioration.
The last time the UK’s trade deficit was over 3% of GDP was in Q2 2002.

Continue reading “UK’s trade deficit hit a record in Q1 2019 due to Brexit stockpiling”
European Union and Eurozone trade statistics for 2018 – EU swings to a trade deficit; EU – record trade surplus with the U.S. and record trade deficit with Russia; UK had largest intra-EU trade deficit
The first estimate of Euro area or Eurozone (EA19) and European Union (EU28) trade statistics by Eurostat for 2018 reveals several interesting insights.
Eurozone and European Union trade stats for January to September 2018; EU trade surplus with the U.S. up 18% year on year as trade deficit with Russia up 38% year on year
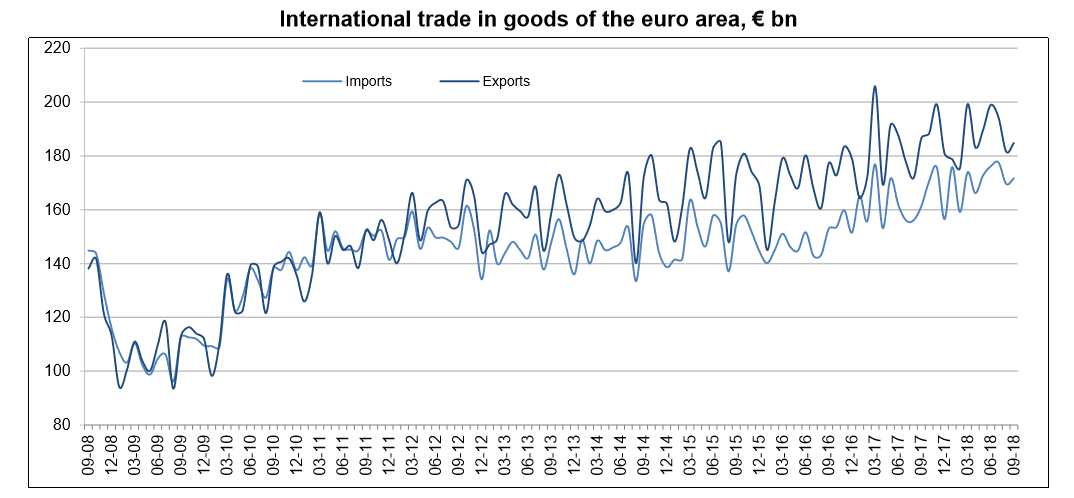
In January to September 2018, Euro area or Eurozone exports of goods to the rest of the world rose to €1,686.0 bn (an increase of 3.6% compared with January to September 2017), while imports rose to €1,542.9 bn (an increase of 5.8% compared with January to September 2017). As a result, the euro area recorded a surplus of €143.1 bn, compared with +€169.2 bn in January-September 2017. Intra-euro area trade rose to €1,449.8 bn in January-September 2018, up by 5.7% compared with January-September 2017.

Have U.S. tariffs on Steel and Aluminium imports really increased domestic production?
We wrote about the economics behind the 25% tariff on Steel imports and 10% tariff on Aluminium imports to the United States earlier this year. One of the main justifications of the tariffs were that they will increase domestic production. Some statistics released earlier this week provide an answer to whether the tariffs have really increased domestic production.
Germany accounts for almost all the intra European Union current account surplus plus the European Union posts a record external current account surplus with the U.S.
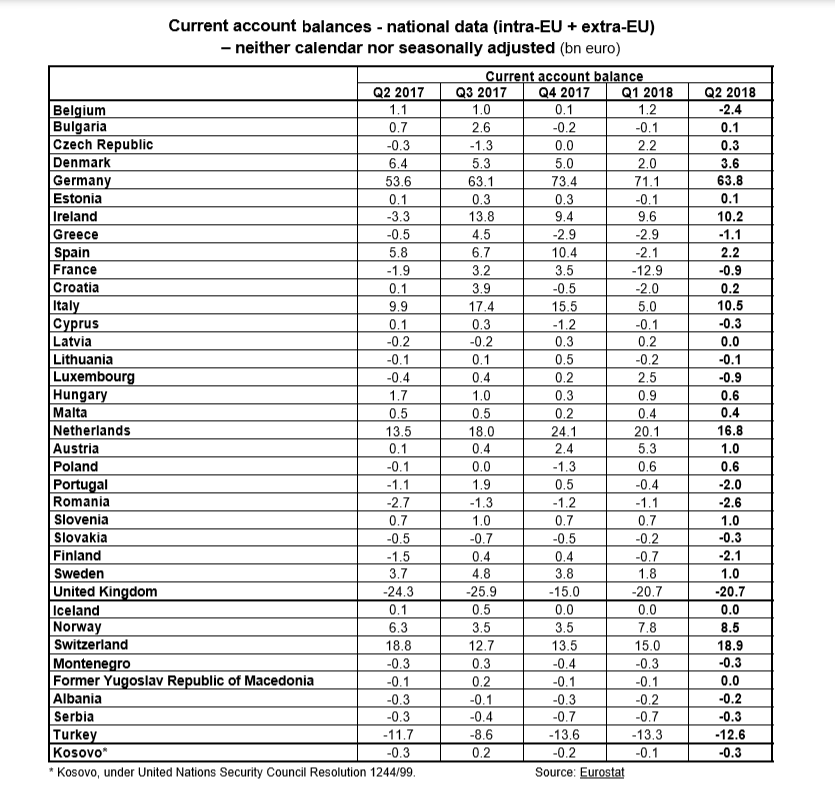
Sixteen members of the European Union recorded current account surpluses, eleven current account deficits and one was in current account balance in the second quarter of 2018 for the total (intra-EU plus extra-EU) current account balances of the European Union (EU28) Member States.
The highest surpluses were observed in Germany (+€63.8 bn), the Netherlands (+€16.8 bn), Italy (+€10.5 bn), Ireland (+€10.2 bn) and Denmark (+€3.6), and the largest deficits in the United Kingdom (-€20.7 bn), Romania (-€2.6 bn) and Belgium (-€2.4 bn).

The story of UK trade with the European Union for the last two decades
We have been publishing a number of statistics for the United Kingdom and the European Union over the last few weeks in the run up to a major piece we will be publishing on the real economics of Brexit. This is the final piece before we publish our post on the real economics of Brexit.
How reliant is the United Kingdom on the European Union for trade? The answer to that is around 52% in 2017 (down from 59% in 1998 and 55% in 2008). 48% of UK exports go the European (EU) Union but 55% of UK imports are from the European Union. Exports to the EU have been decreasing but imports have been increasing. 69% of the trade deficit of the United Kingdom can be attributed to trade with the European Union.
Continue reading “The story of UK trade with the European Union for the last two decades”
Are major exporter countries to the United States really manipulating their currency to boost exports?
The Euro Area, China, Canada, Mexico and Japan together account for over 70% of U.S. trade. Have these countries (including the Euro Area group of countries) manipulated their currencies to boost exports? In this century (2000 onwards) the Chinese Yuan, the Canadian Dollar and the Euro have appreciated against the dollar. The Japanese Yen has been largely unchanged against the U.S. dollar since the start of this century and only the Mexican Peso has weakened against the dollar.
UK Trade Statistics for trade by each product (and split by EU and non-EU trade) plus interactive tool for trade by each country
We will be publishing a number of statistics for the United Kingdom (and the European Union) over the next few days in the run up to a major piece we will be publishing on the real economics of Brexit. In the meanwhile, here are trade statistics for trade by each product for the United Kingdom for 2017 (the latest full year of data available) sourced from the Office for National Statistics.
Do nations with balance of payments or trade surpluses really outperform those with deficits?
Does a balance of payment (or trade) surplus equate higher growth? Not necessarily, Australia which has had deficits for over forty years has grown faster than Germany which has had over forty years of surpluses. Does a current account surplus (i.e. exports greater than imports) mean a nation is doing better than other nations with current account deficits? The answer is no, what really matters is why the deficits exist.