We have been publishing a number of statistics for the United Kingdom and the European Union over the last few weeks in the run up to a major piece we will be publishing on the real economics of Brexit. This is the final piece before we publish our post on the real economics of Brexit.
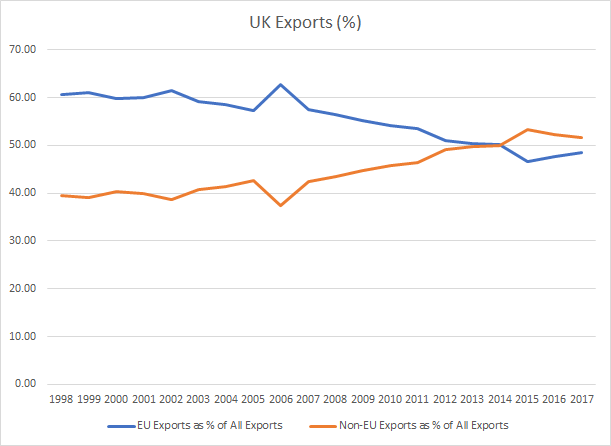
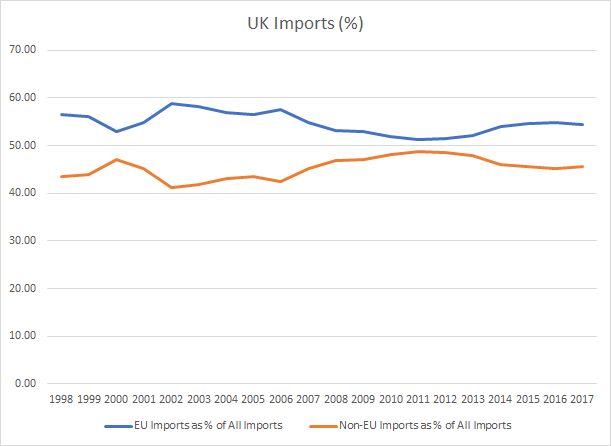
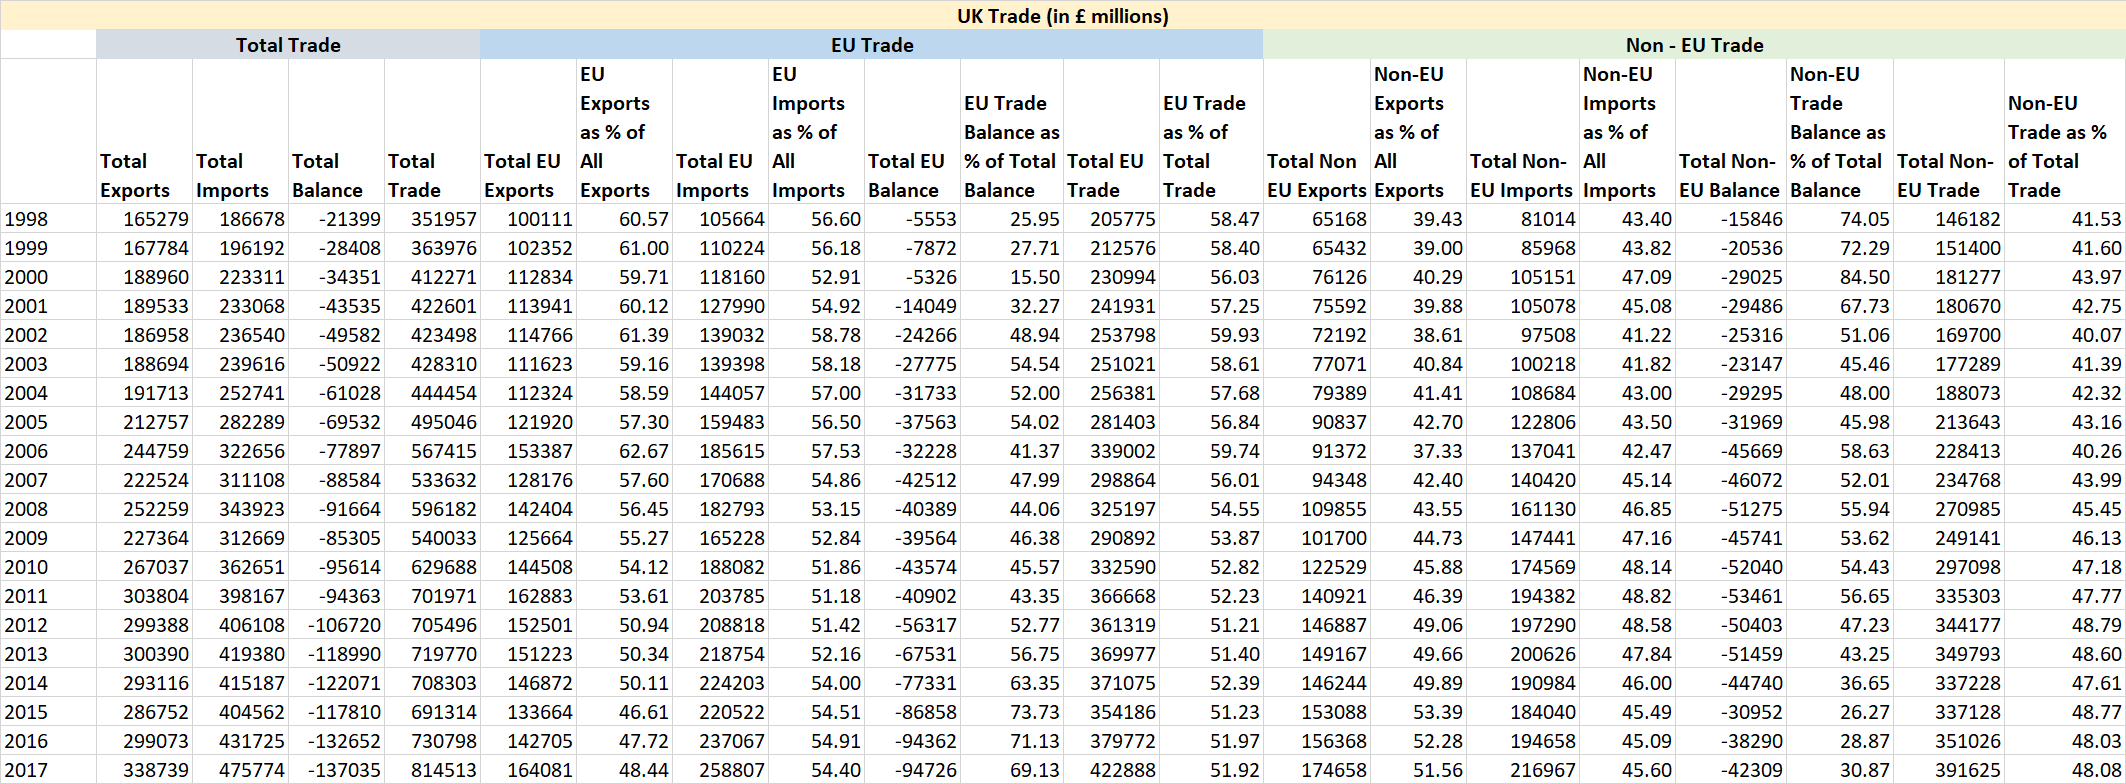
How reliant is the United Kingdom on the European Union for trade? The answer to that is around 52% in 2017 (down from 59% in 1998 and 55% in 2008). 48% of UK exports go the European (EU) Union but 55% of UK imports are from the European Union. Exports to the EU have been decreasing but imports have been increasing. 69% of the trade deficit of the United Kingdom can be attributed to trade with the European Union.
Exports to EU countries have been decreasing as exports to non-EU countries have been increasing
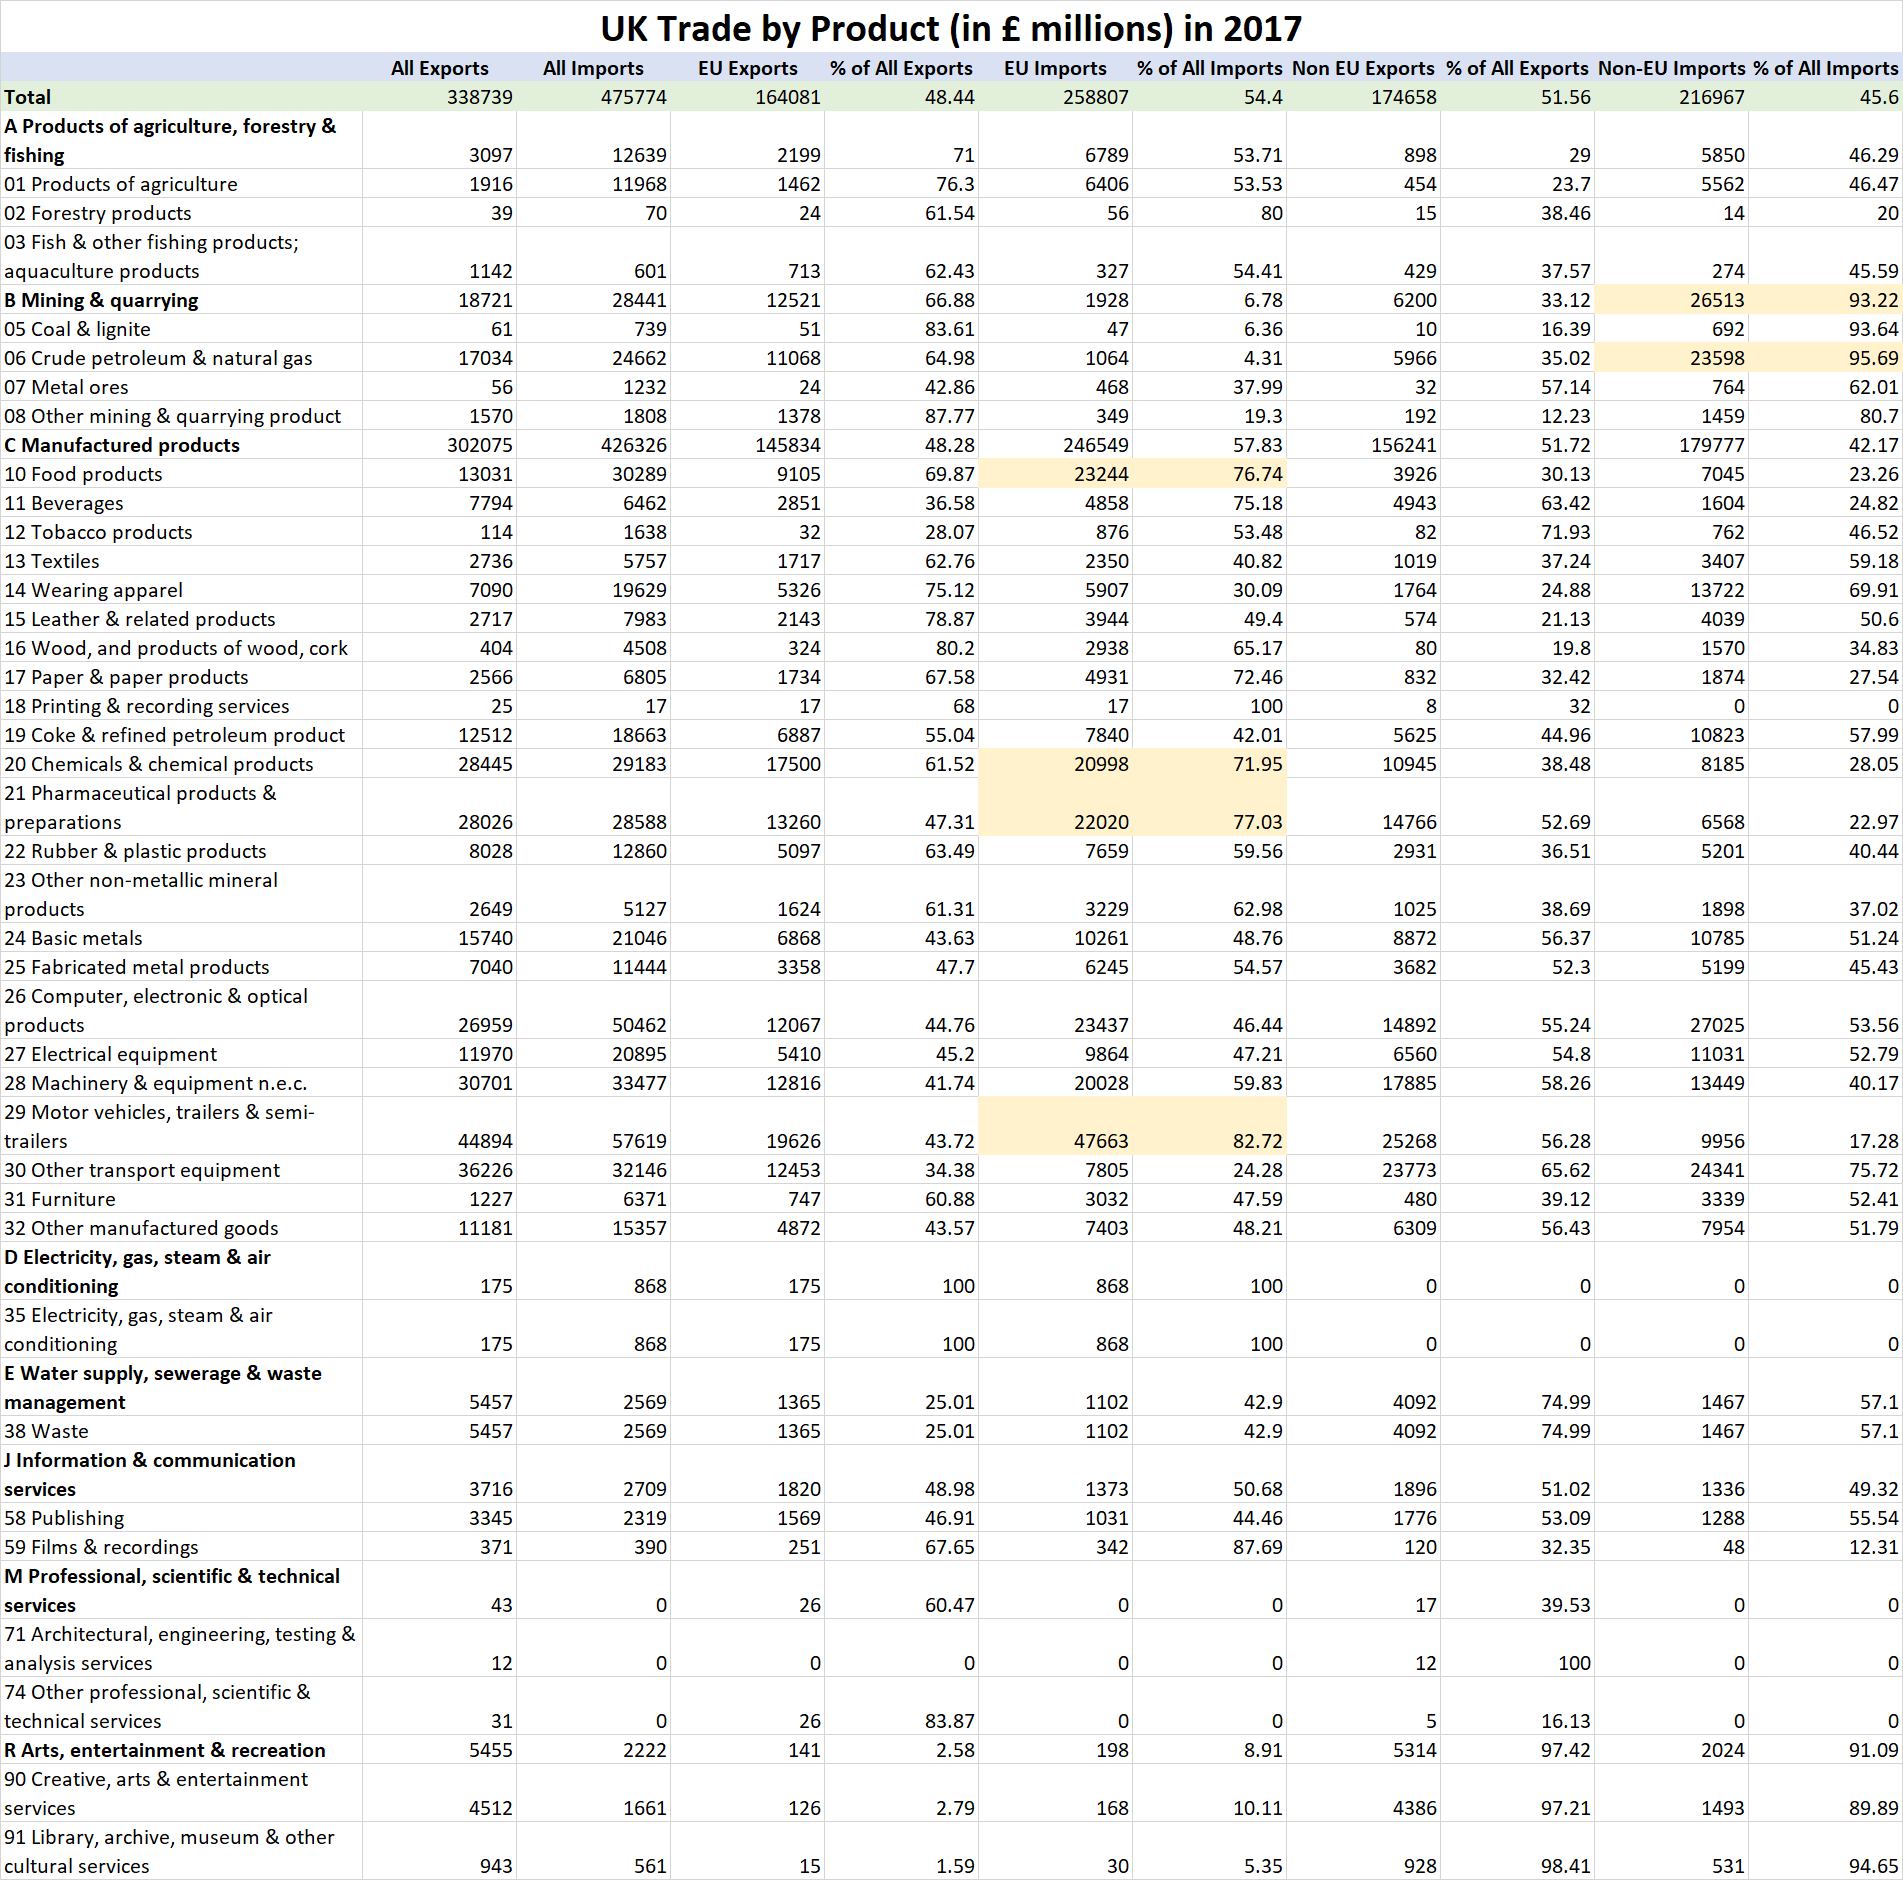
- £25 billion (or 57% of all exports in the category) of all cars manufactured in the UK in 2017 were exported to non-EU countries.
- £24 billion (or 66% of all exports in the category) of other transport equipment were exported to non-EU countries in 2017.
- £18 billion (or 58% of all exports in the category) of all machinery exports were exported to non-EU countries in 2017.
Imports from the EU have been increasing mainly down to tariff’s on non-EU imports
- £48 billion (or 83% of all imports in the category) of Motor Vehicles were imported from the EU in 2017.
- £22 billion (or 77% of all imports in the category) of Pharmaceutical products were imported from the EU in 2017.
- £21 billion (or 72% of all imports in the category) of Chemicals were imported from the EU in 2017.
- £23 billion (or 77% of all imports in the category) of Processed foods were imported from the EU in 2017.
Motor Vehicles, Pharmaceutical products, Chemicals and Processed foods are all categories where the EU has high import tariffs.
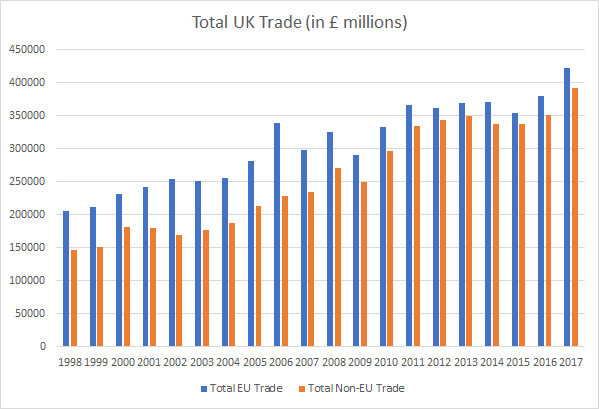
Trade with non-EU countries have been increasing at a quicker pace than trade with the EU
48% of UK exports went the European Union in 2017 but 55% of UK imports were from the European Union in 2017. Like we covered previously, Exports to the EU have been decreasing but imports have been increasing.
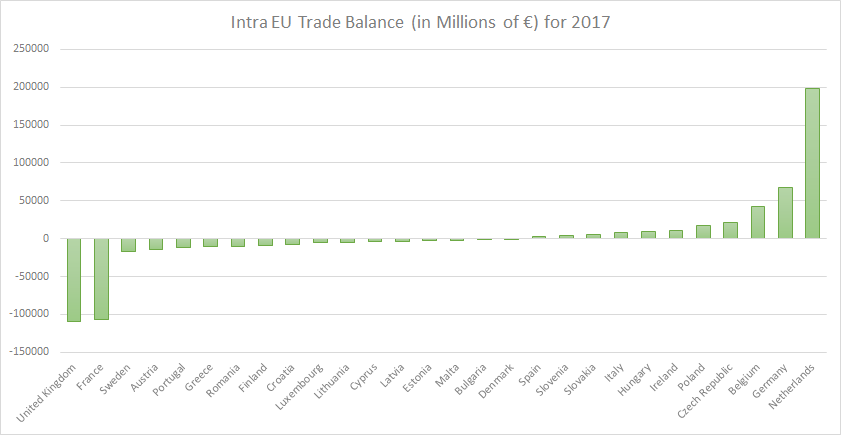
69% of the trade deficit of the United Kingdom can be attributed to trade with the European Union
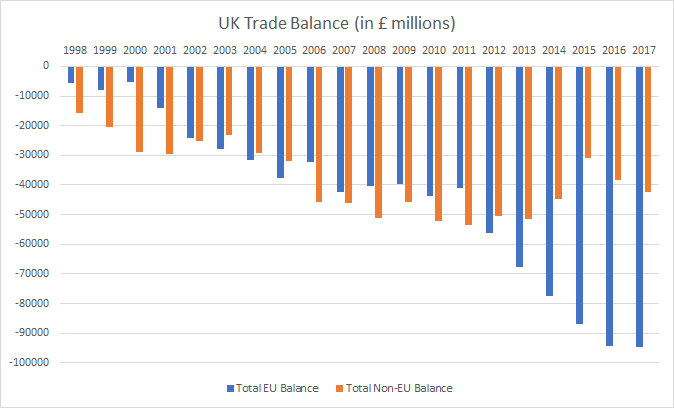
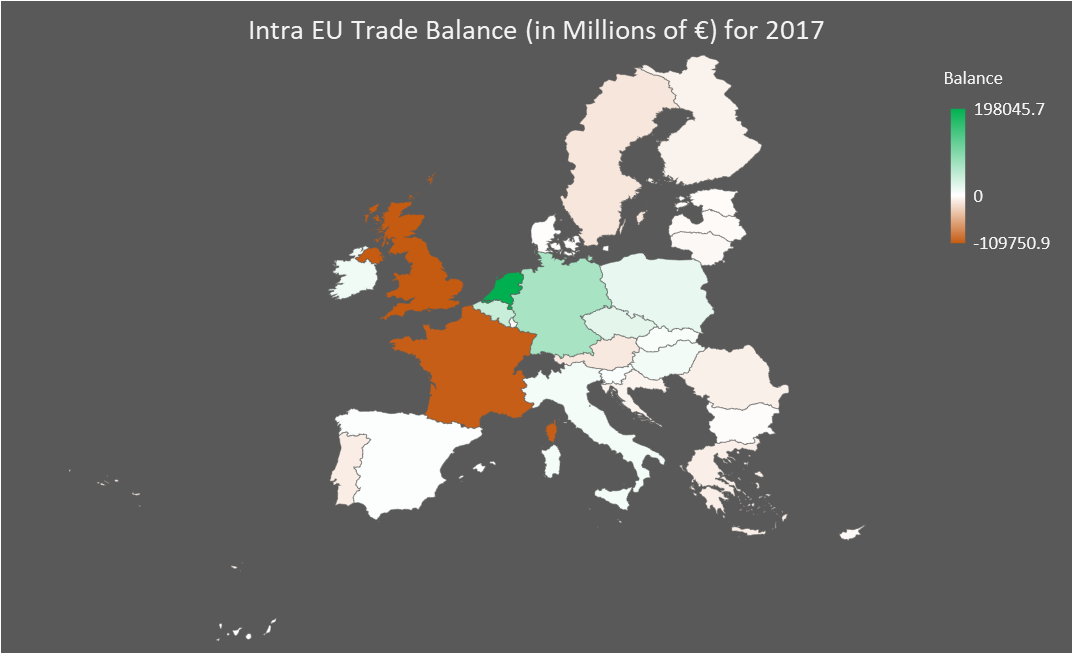
The United Kingdom had the largest deficit in intra-EU trade in 2017,
Here is the dataset for UK trade for the past two decades split by EU and non-EU trade,
Here is the dataset for UK trade by product in 2017,
Here is the dataset for Intra EU Trade in 2017,
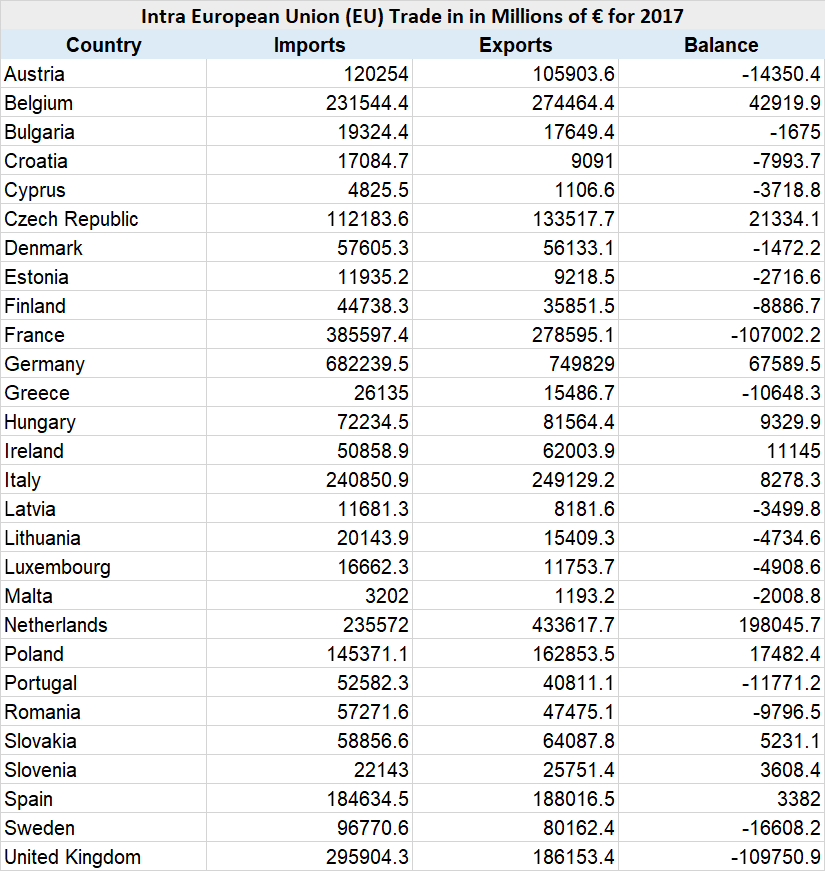
The European Union (EU28) currently includes Belgium, Bulgaria, the Czech Republic, Denmark, Germany, Estonia, Ireland, Greece, Spain, France, Croatia, Italy, Cyprus, Latvia, Lithuania, Luxembourg, Hungary, Malta, the Netherlands, Austria, Poland, Portugal, Romania, Slovenia, Slovakia, Finland, Sweden and the United Kingdom.
Everything Brexit:
UK Trade Statistics for trade by each country
Past, present, future – some demographic and economic statistics for the European Union
Europe’s lost economic decade in charts
Here’s how the demographic and economic statistics look for candidate members of the European Union