It has been 10 years since the collapse of Lehman Brothers triggered the largest economic crash in living memory, how much has really changed since then? A lot has changed since then but not entirely as one would have expected …
Global Debt is soaring
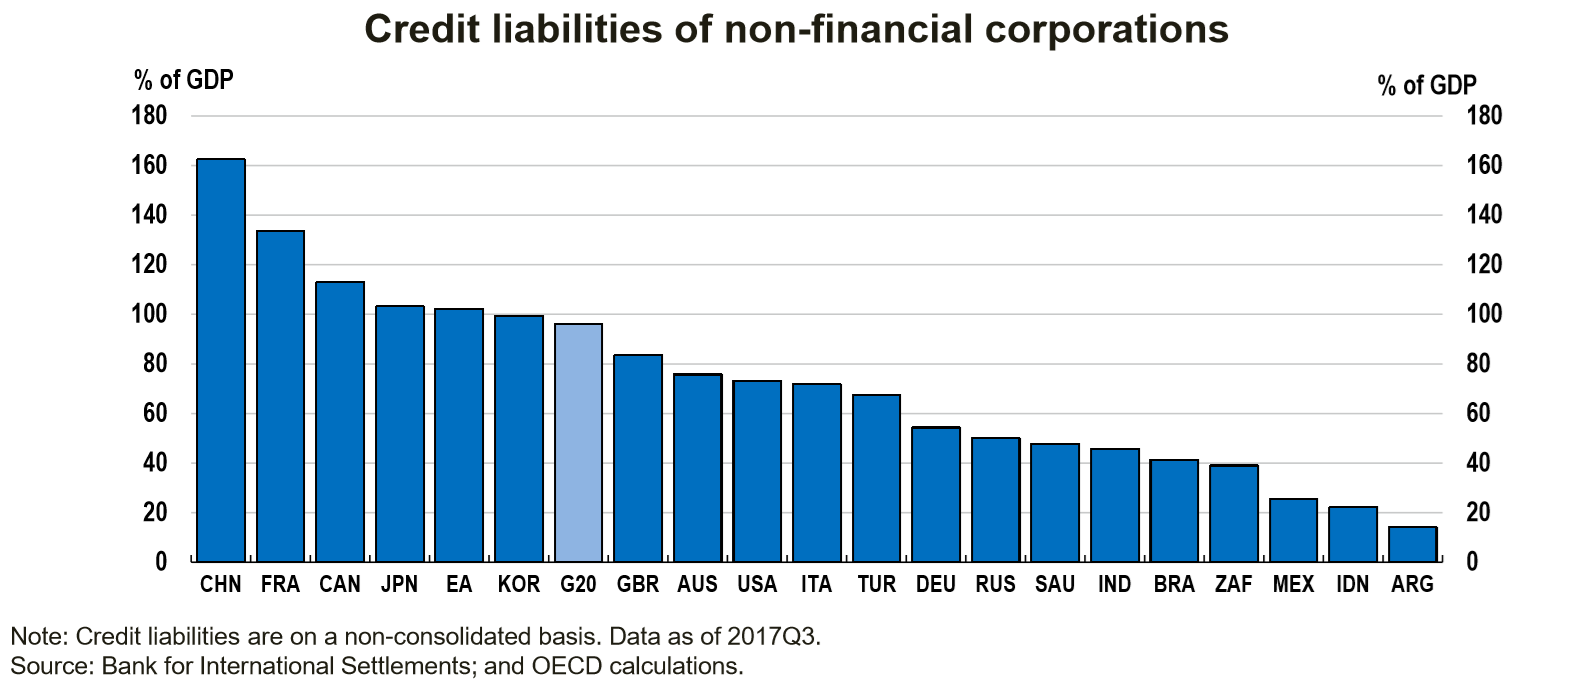
Global debt hit a mind-boggling $250 trillion earlier this year. Credit liabilities of non-financial corporations in the G20 is close to 100% of GDP. Corporations have borrowed loads of money relatively cheaply to buy back their own stock, that’s a typical way an asset bubble is created.
Valuations are still crazy
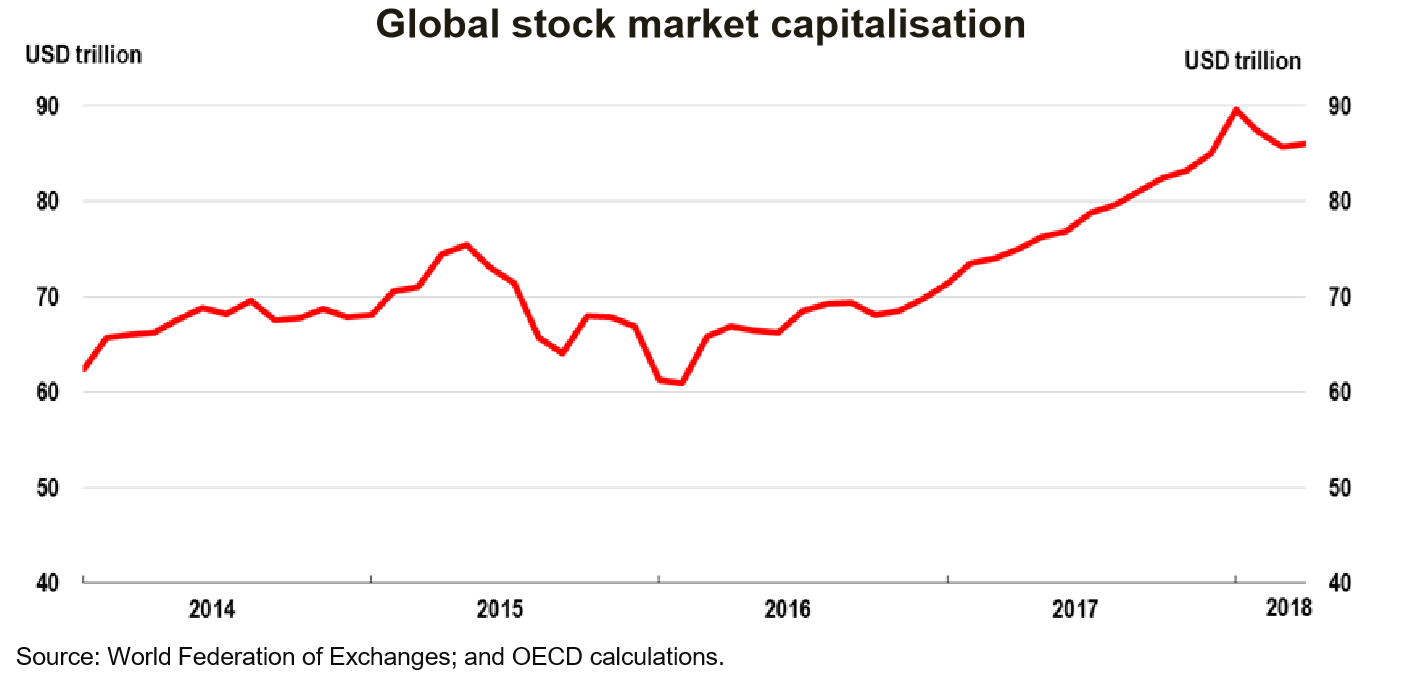
Equities globally have never been more valuable with market capitalization now close to $95 trillion.
Amazon trades at a Price to Earnings ratio of some 250. Apple is worth over a trillion U.S. dollars. Even Tesla which makes no profit and is unlikely to make any profit any time soon is worth some $53 billion, more than Ford or General Motors.
Netflix is valued at $164 billion (14 times revenues of $11.7 billion) with 110 million paid (and 117 million total) subscribers. Netflix trades at a price to earnings ratio of 225. The company expects free cash flow of minus $3 to minus $4 billion in 2018 (yes, that is negative cash flow). Yet Netflix’s market cap is now greater than Disney’s and Comcast’s.
In the unlisted space, the Tinder equivalent for Pets is valued at around $400 million. WeWork, the shared workspaces company created in 2010 is worth some $30 billion with about $30 in outstanding rent, payments or debt. WeWork, until we don’t.
European House Prices have got hammered
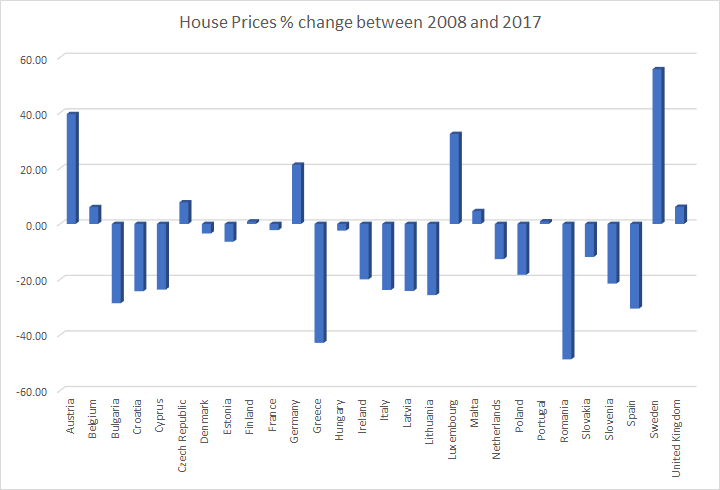
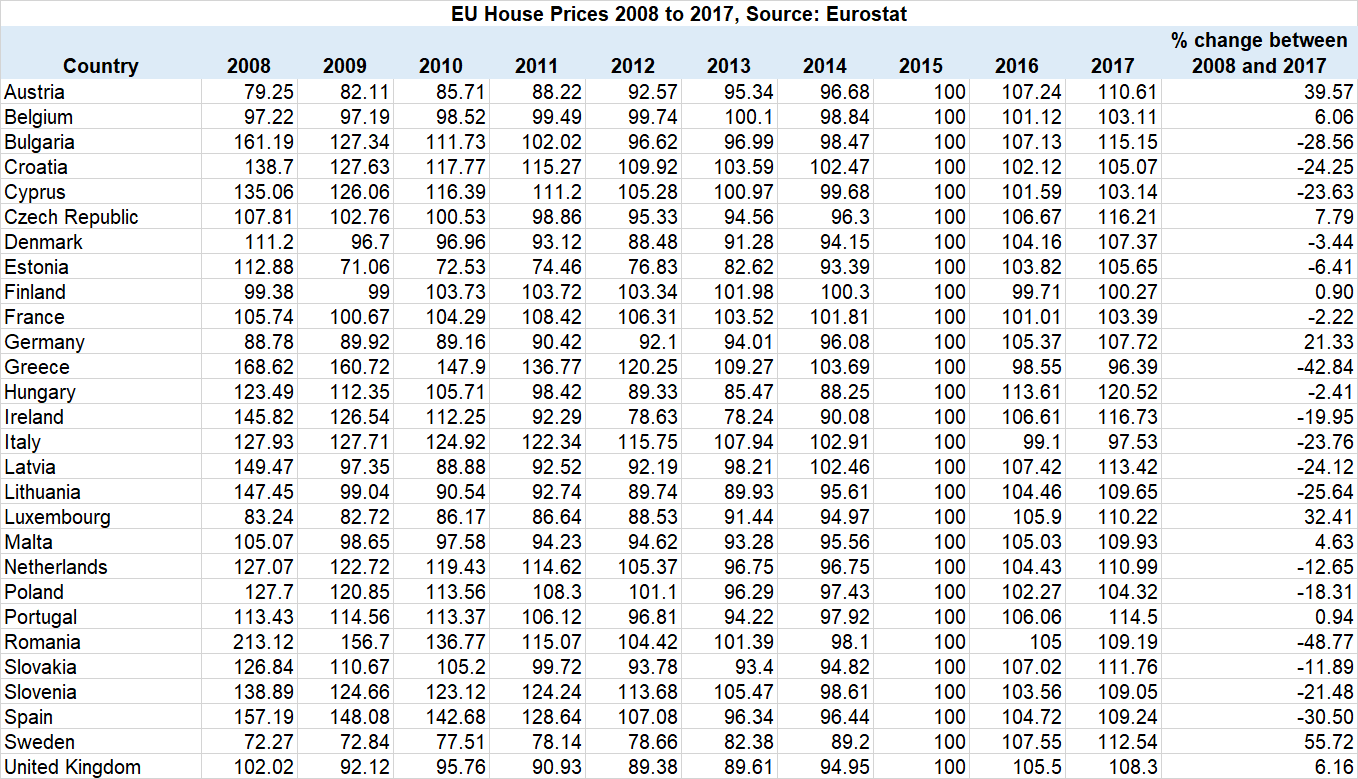
18 of the 28 countries that are part of the European Union saw house prices fall between 2008 and 2017. Romania (-48.77%), Greece (-42.84%) and Spain (-30.50%) were the 3 worst performing countries for house prices in the European Union.
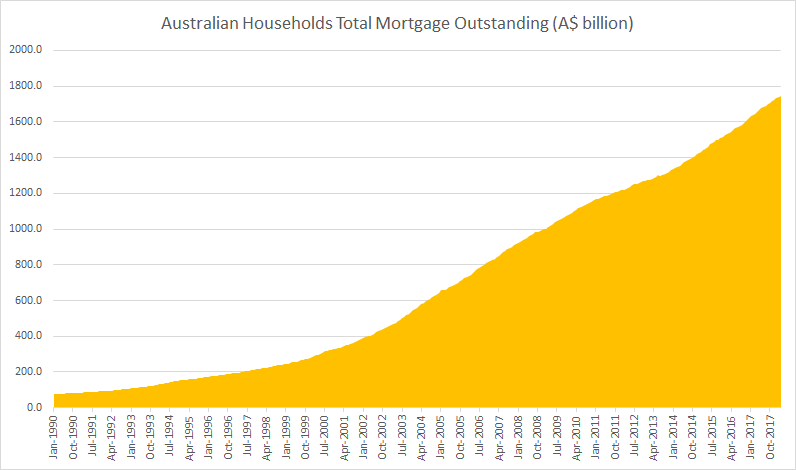
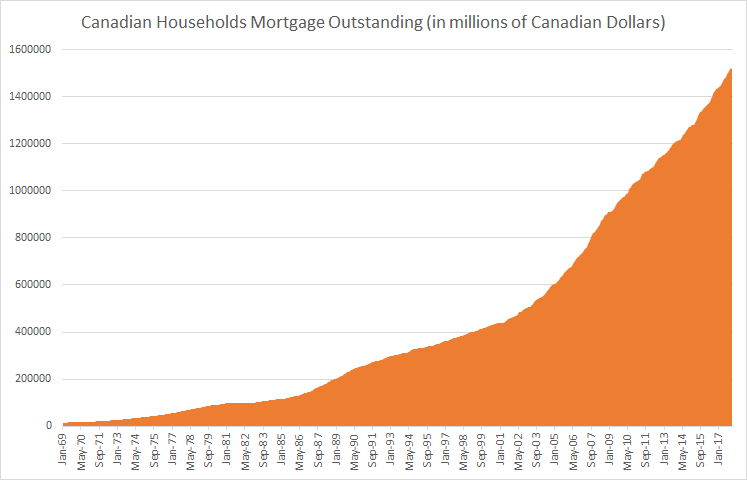
But Australians and Canadians are borrowing a lot of money to buy property
Australia – Total Residential Mortgage Debt Outstanding: A$1.75 trillion (Up 67% since September 2008), 96% of GDP (2017)
Canada – Total Residential Mortgage Debt Outstanding: C$1.53 trillion (Up 70% since September 2008), 102% of GDP (2017)
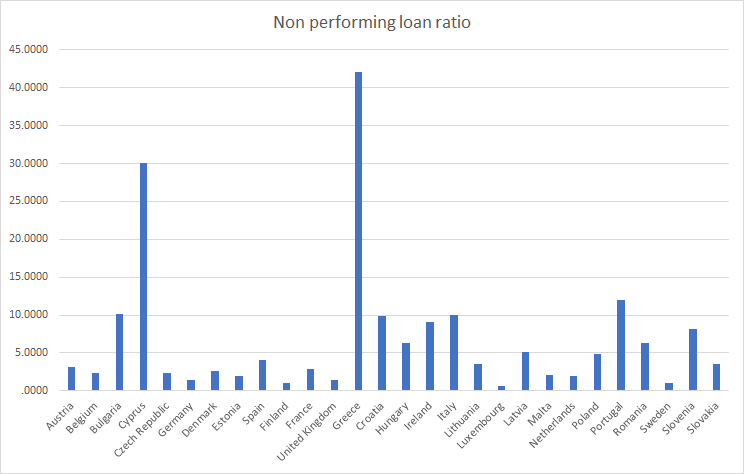
The European Banking Crisis
Banks in Greece, Cyprus, Portugal and Italy have a non-performing loan ratio of over 10% a decade on from the financial crisis and have only provisioned around 50% of the losses. The European Banking Crisis is far from over.
2018 feels just like 2008 for European Banks …
Some things never change, they just become different. This time it is different.