Hidden away in the European Central Bank’s supervisory and prudential statistics are metrics for asset quality. It isn’t easy to find and if you do find them then the spreadsheets won’t open without issues. Once If you manage to get them to work you will find some quite stunning statistics.
Here are the numbers and graphs for asset quality as of September 30, 2017 (the latest set of data available),
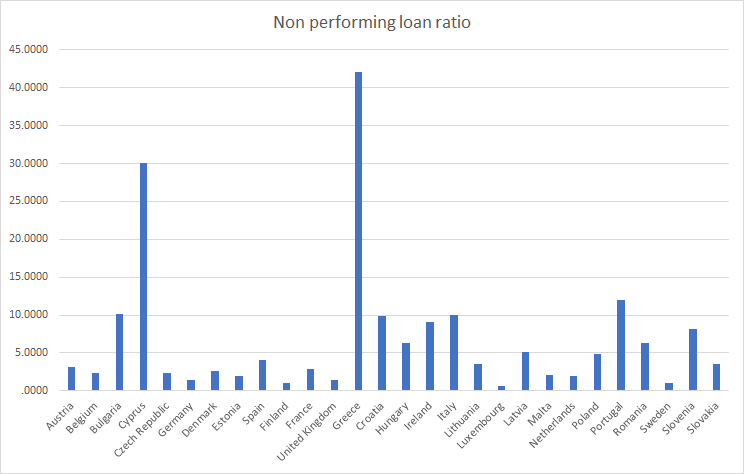
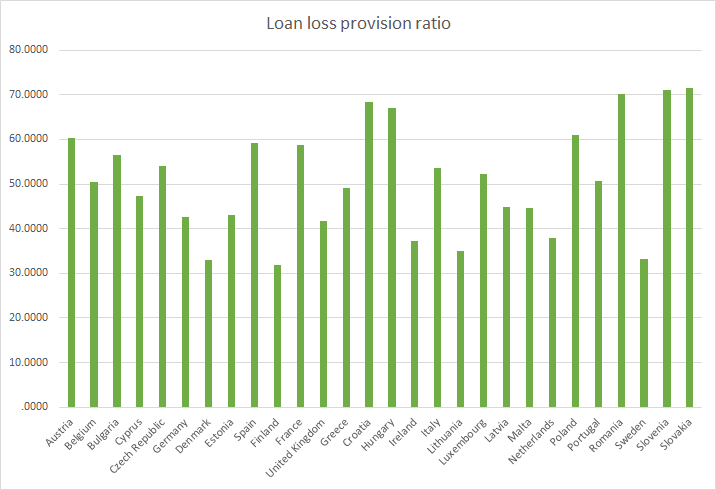
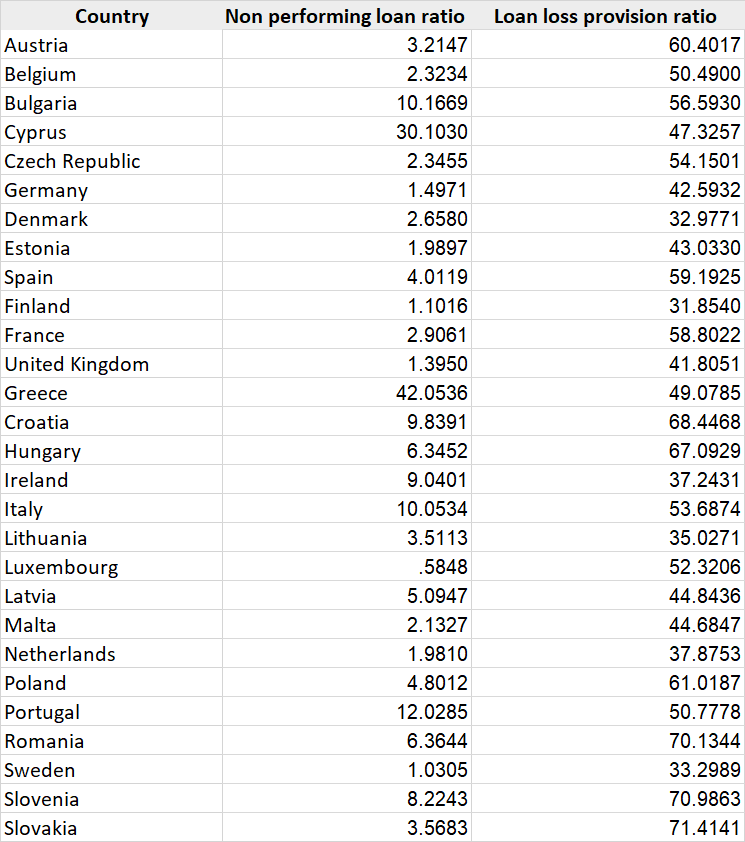
Greece, Cyprus, Portugal and Italy have high non performing loan ratios and have only provisioned around 50% of the losses.
What is truly fascinating is that Greece (Moody’s Credit Rating: Caa2) is now paying about 85 bps lower interest on 2-year bonds than the US (Moody’s Credit Rating: Aaa). And 10-year bond yields at around 4% are the lowest in 13 years. All in spite of a 42% non performing loan ratio for banks operating in the country.
To be fair, the non performing loan ratio has been coming down but extremely slowly. Enough hasn’t been done since 2008 and it is a decade since the crisis began.
The biggest question is who holds the largest counterparty risk? We have done some analysis and will hopefully write about it in a few days.