UK house sales and house price growth are slowing but is this time any different?

Several people in the UK didn’t experience the great (property price) crash of 2008. But several other people did. A decade on – do people remember? Here is a sample of prices from London’s financial district – Canary Wharf. And no, we haven’t taken the worst-case example, this is truly representative,

Continue reading “UK house sales and house price growth are slowing but is this time any different?”

Comparison of house price indices (Halifax, Nationwide, Rightmove, UK House Price Index and LSL) in the UK

We asked the question, Are the British obsessed about house buying and house prices? a couple of months ago.

The British are obsessed about house prices because most of their wealth outside of pensions is invested in property.

UK household wealth by asset type
Source: Office for National Statistics

Here is a summarized comparison of the different house price indices in the United Kingdom,

Continue reading “Comparison of house price indices (Halifax, Nationwide, Rightmove, UK House Price Index and LSL) in the UK”

Weekly Overview: The Baltic Dry Index is up 48% over the past month; Argentina seeks IMF bailout; UK House Prices; Brazil 10-year bond tops 10%; Coal prices soaring

Baltic Dry Index

The Baltic Dry Index is a trade indicator that measures shipping prices of major raw materials and is often seen as a global growth indicator.

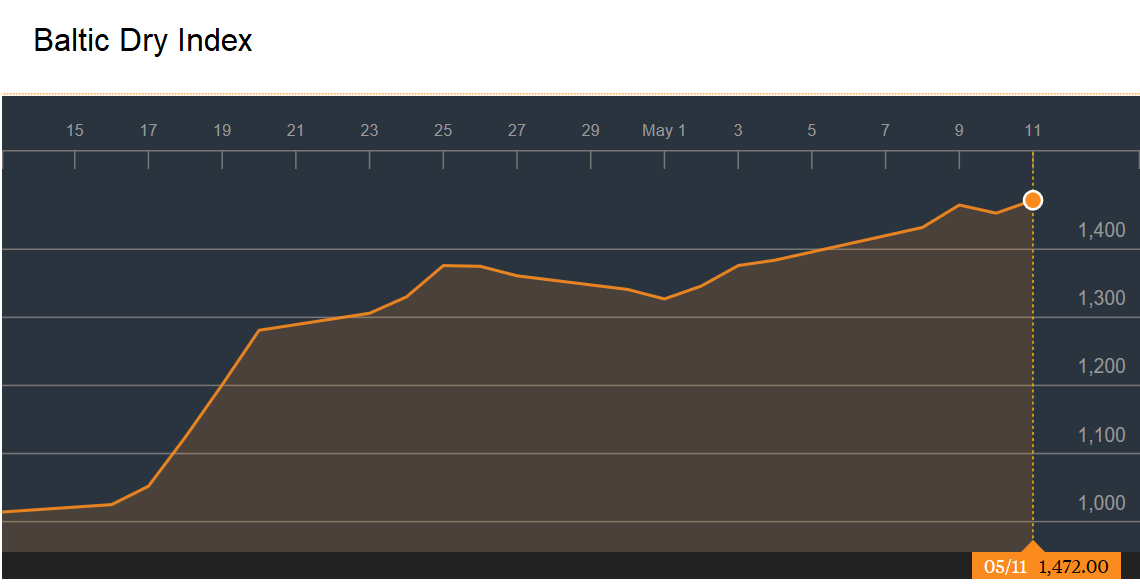
Over the past month, it has zoomed 48%. It is up 45% over the past year and is up 8% since the start of the year. This despite weaker US, UK and France Q1 2018 GDP growth. The Baltic Dry index generally falls in the first quarter on back of lower trading activity due to the Chinese New Year but this time it hadn’t recovered until very recently.

Here is a chart of the index over the past month,

Continue reading “Weekly Overview: The Baltic Dry Index is up 48% over the past month; Argentina seeks IMF bailout; UK House Prices; Brazil 10-year bond tops 10%; Coal prices soaring”

Here’s how house prices in the European Union have changed between 2008 and 2017

Based on data from Eurostat, here are key takeaways about house prices in the European Union between 2008 and 2017,

  • 18 of the 28 countries that are part of the European Union saw house prices fall
  • 10 of the 28 countries that are part of the European Union saw house prices rise
  • Only 4 countries have seen prices rise over 10% during the entire period
  • 14 countries have seen prices fall over 10% during the entire period
  • Romania (-48.77%), Greece (-42.84%) and Spain (-30.50%) were the 3 worst performing countries for house prices
  • Sweden (+55.72%), Austria (+39.57%) and Luxembourg (+32.41%) were the 3 best performing countries for house prices
  • The average house price across the European Union fell 6.98% between 2008 and 2017
EU house price change 2008 to 2017, Source: Eurostat

Continue reading “Here’s how house prices in the European Union have changed between 2008 and 2017”