Are more houses being constructed? And what about the average and median prices of houses being sold?
Chart 1 – Average sales price of houses sold
Average prices were increasing for 10 years until 2018. In Q4 2018 the average price of a house sold was $378,900 (up from $260,000 in 2011). Does this mean more expensive houses are not selling or does this mean more houses priced lower than the average price are selling well dragging the average price lower?
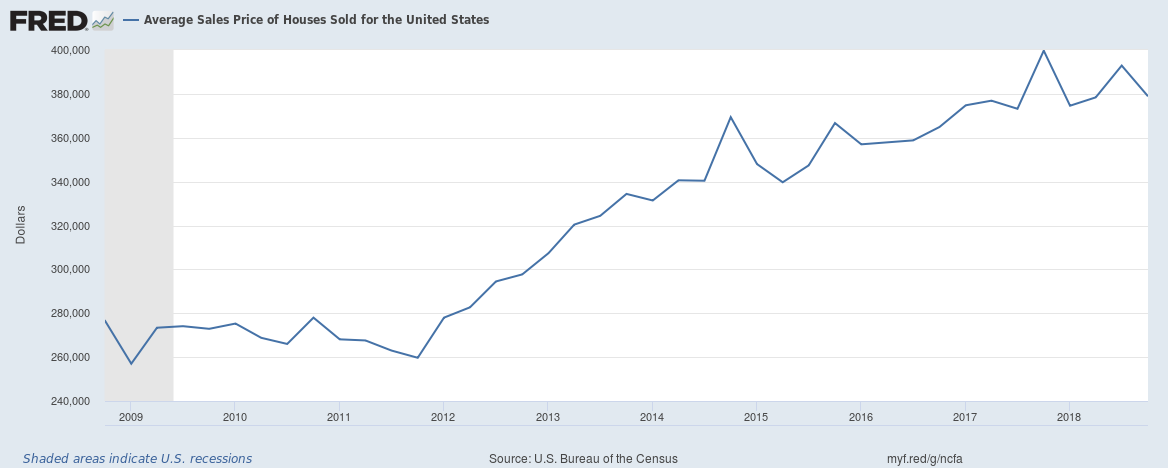
Chart 2 – Median sales price of houses sold
Like average prices, median prices of houses sold fell in 2018 as well. In Q4 2018 the median price of a house sold was $317,400 (up from $221,000 in 2010).
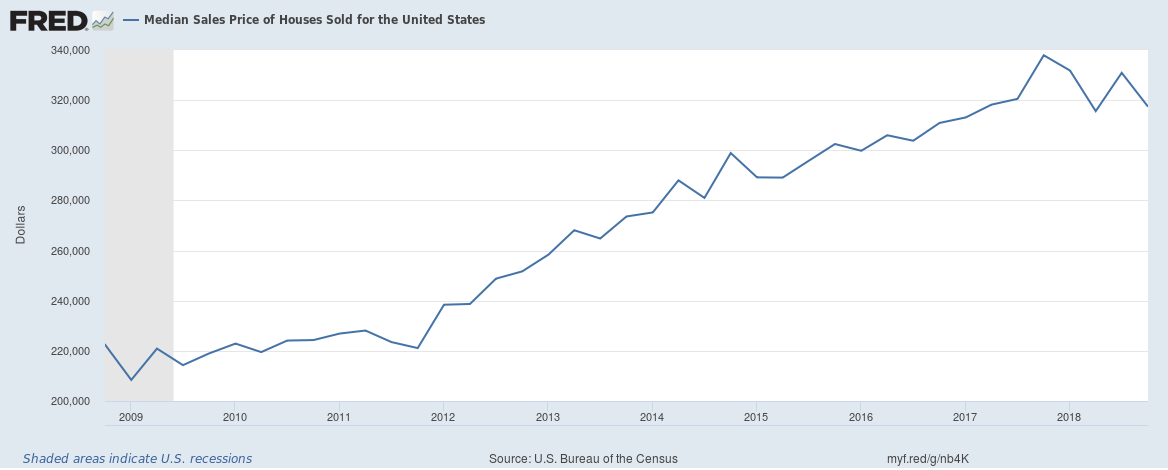
Chart 3 – House starts fell by 11% in Q4 2018
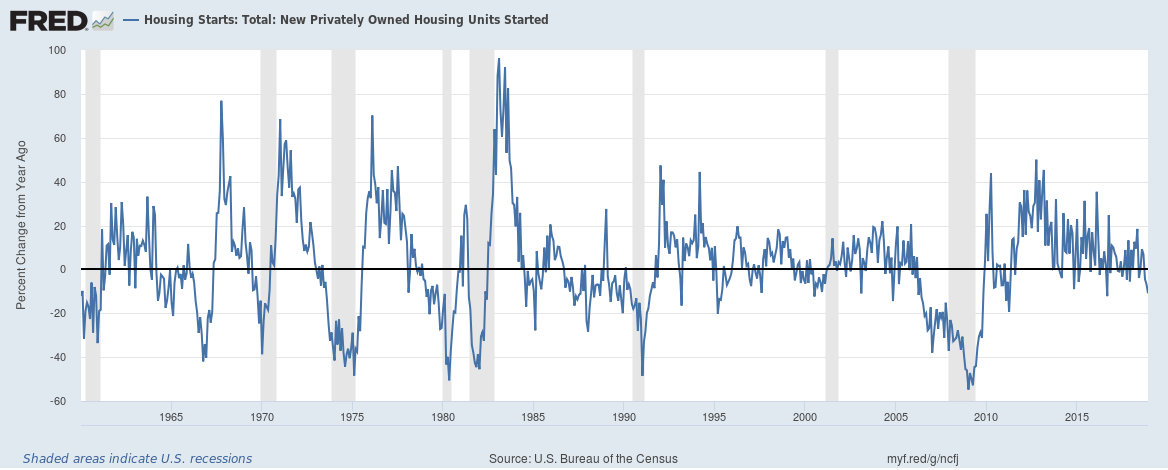
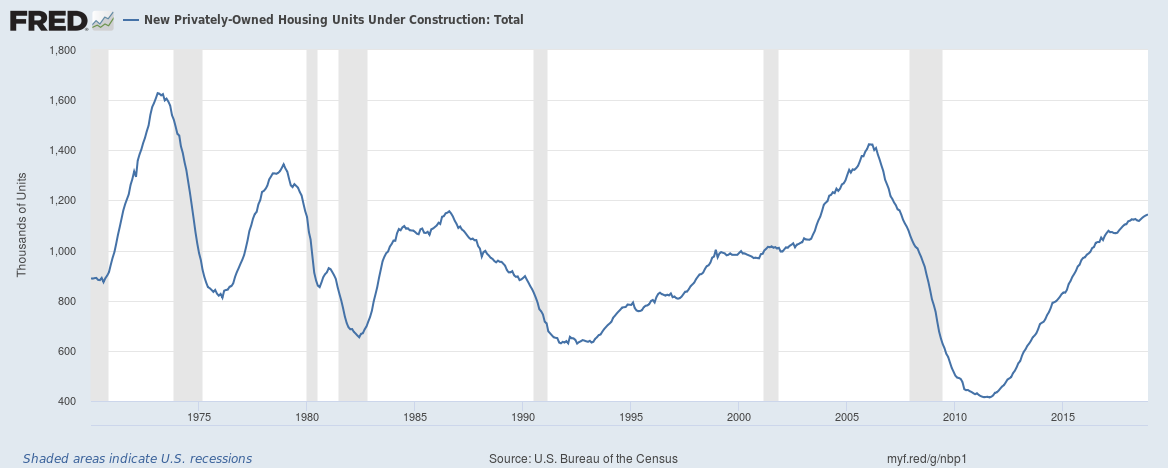
Chart 4 – Number of houses under construction have been rising since 2010
New houses under construction reached 1.14 million in December 2018 up from an average of 400,000 in 2010. The housing market is still buoyant.