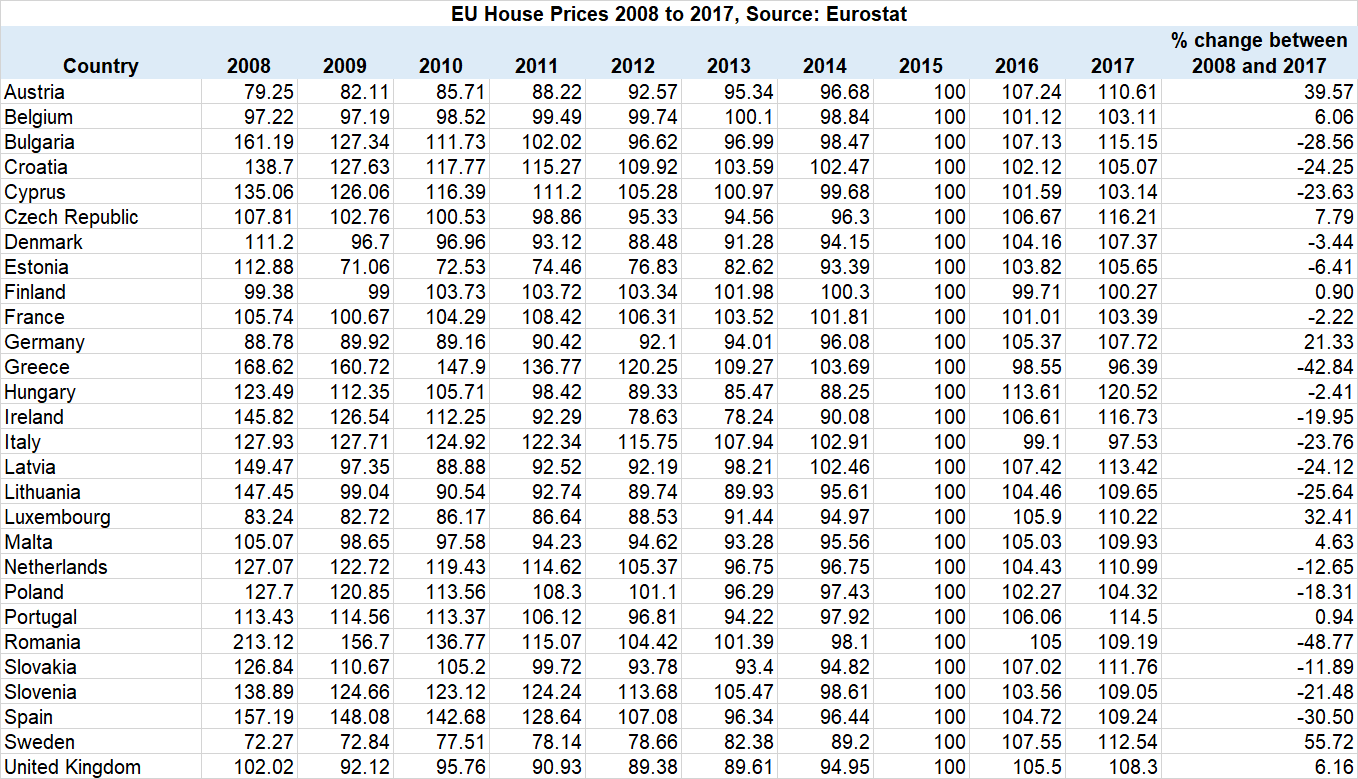
Based on data from Eurostat, here are key takeaways about house prices in the European Union between 2008 and 2017,
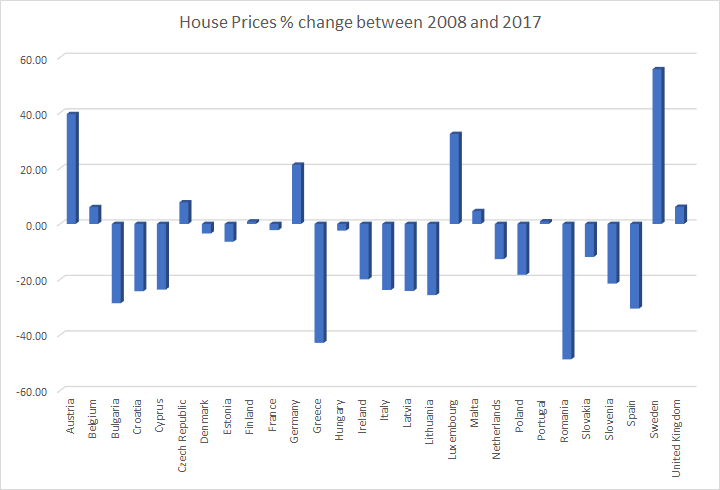
- 18 of the 28 countries that are part of the European Union saw house prices fall
- 10 of the 28 countries that are part of the European Union saw house prices rise
- Only 4 countries have seen prices rise over 10% during the entire period
- 14 countries have seen prices fall over 10% during the entire period
- Romania (-48.77%), Greece (-42.84%) and Spain (-30.50%) were the 3 worst performing countries for house prices
- Sweden (+55.72%), Austria (+39.57%) and Luxembourg (+32.41%) were the 3 best performing countries for house prices
- The average house price across the European Union fell 6.98% between 2008 and 2017
Data (baseline 100 in 2015)