The media has recently been writing about an apparent house price crash for UK house prices but it isn’t that bad. We wrote in May that UK house sales and house price growth are slowing, the on the ground situation hasn’t changed since and the newly available statistics support that.
As per the latest release from the Office for National Statistics, average house prices in the UK have increased by 3.0% in the year to June 2018 (down from 3.5% in May 2018). This is its lowest annual rate since August 2013 when it was also 3.0%. The annual growth rate has slowed since mid-2016 and has remained under 5%, with the exception of October 2017, throughout 2017 and into 2018.
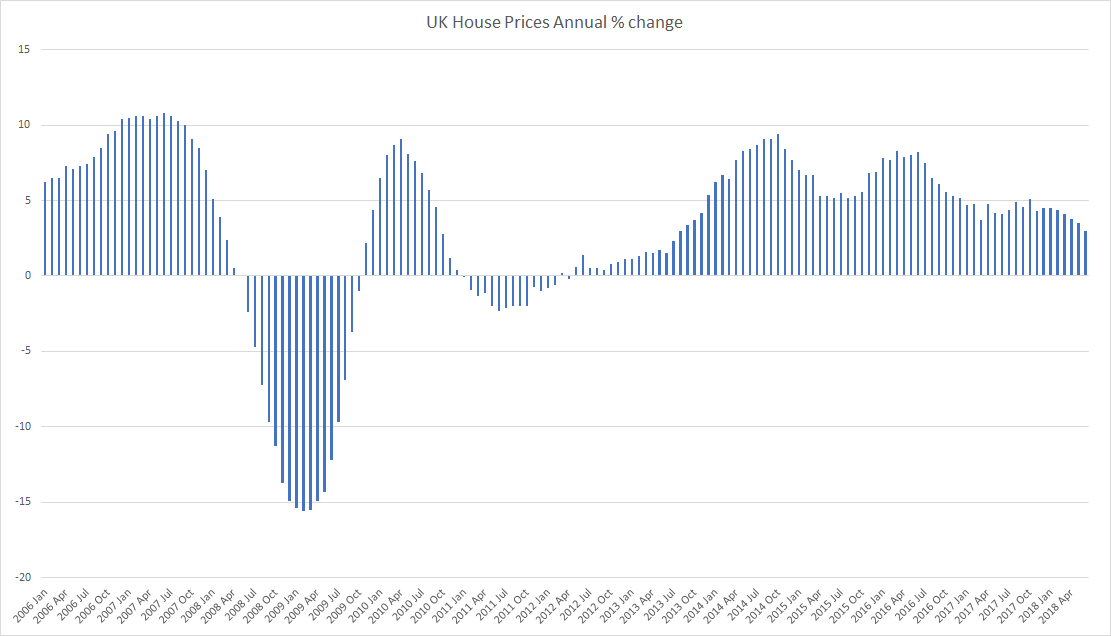
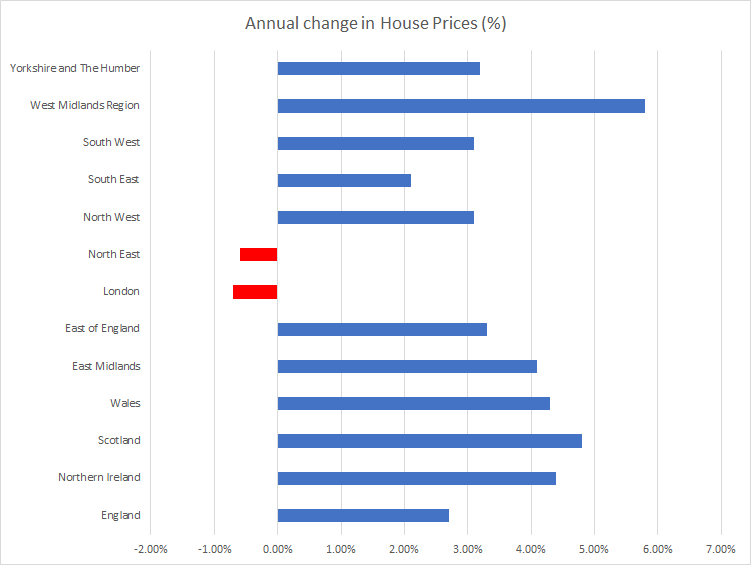
This slowdown in UK house price growth over the past two years is driven mainly by a slowdown in the south and east of England. The lowest annual growth was in London, where prices decreased by 0.7% over the year, down from negative 0.2%. This is its lowest annual growth rate since September 2009 when it was negative 3.2%. London has shown a general slowdown in its annual growth rate since mid-2016.
The average UK house price was £228,000 in June 2018. This is £6,000 higher than in June 2017 and £1,000 higher than last month. On a seasonally adjusted basis (series available in data downloads), average house prices in the UK were unchanged (0.0%) between May 2018 and June 2018, compared with an increase of 0.5% in average prices during the same period a year earlier (May 2017 and June 2017).
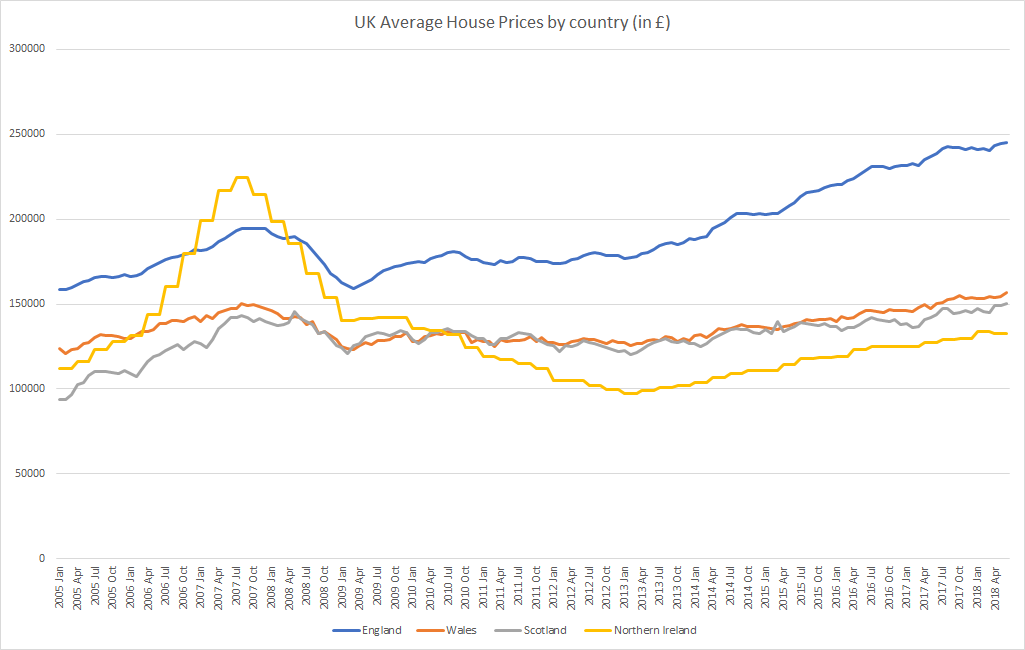
The main contribution to the increase in UK house prices came from England, where house prices increased by 2.7% over the year to June 2018, with the average price in England now £245,000.
Wales saw house prices increase by 4.3% over the last 12 months to stand at £157,000.
In Scotland, the average price increased by 4.8% over the year to stand at £150,000.
The average price in Northern Ireland currently stands at £133,000, an increase of 4.4% over the year to Quarter 2 (April to June) 2018.
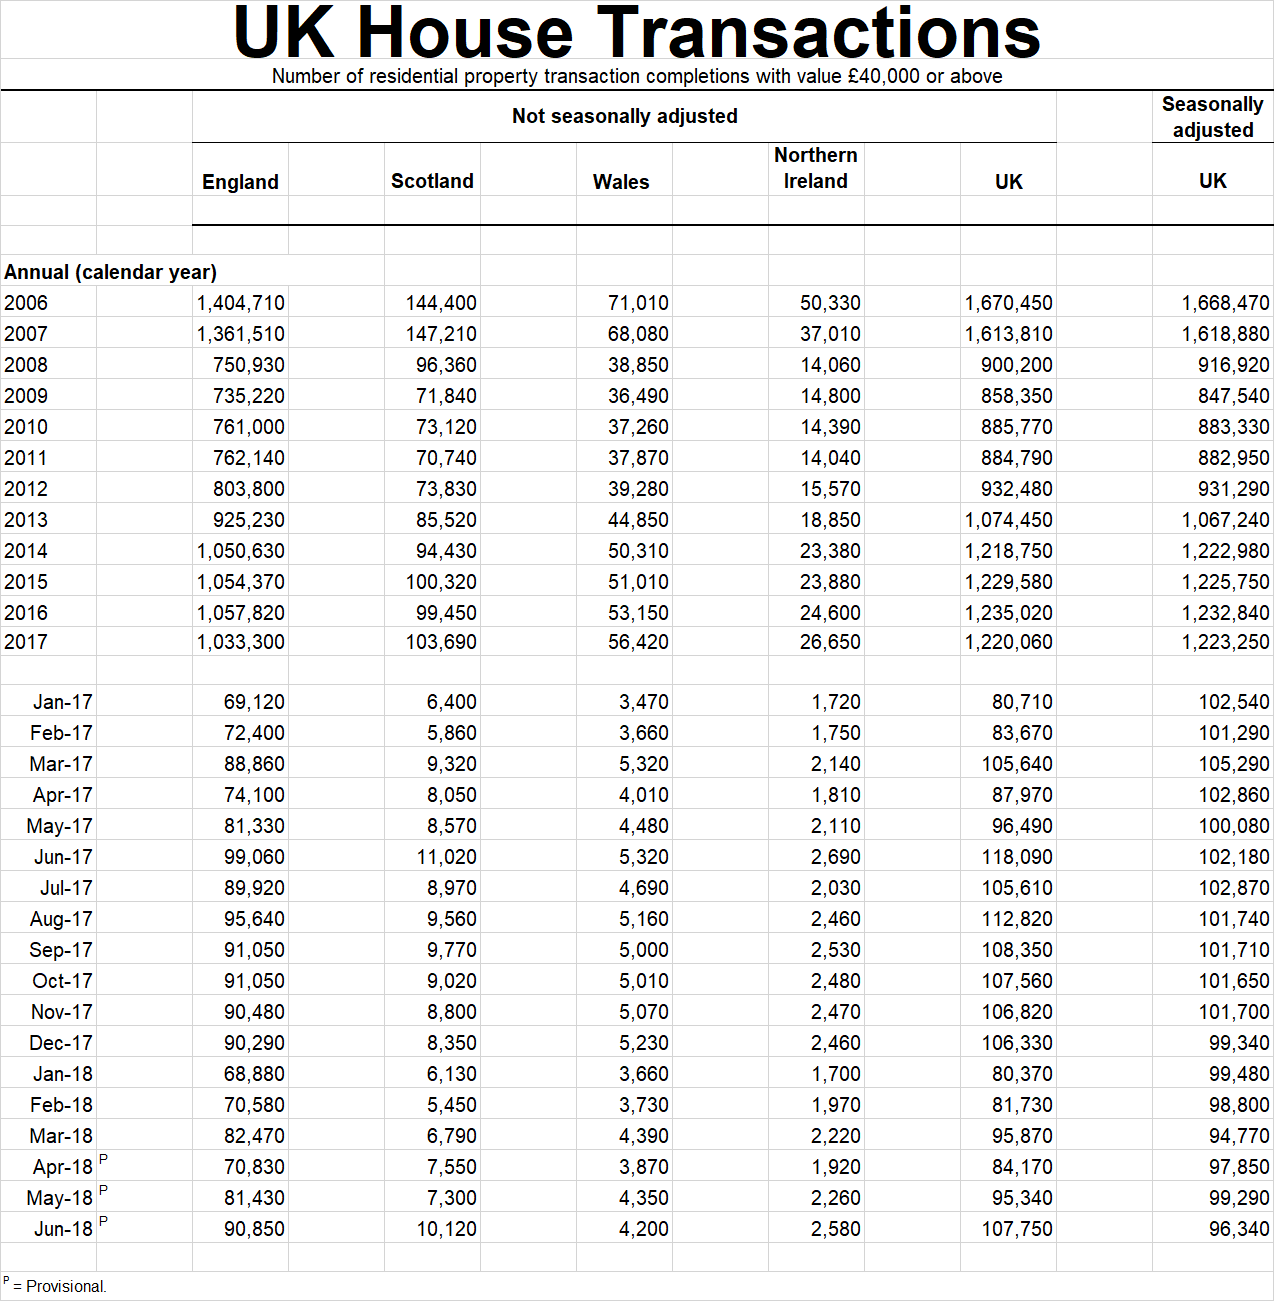
House transactions are slightly lower, but these are provisional numbers and are generally revised upwards,
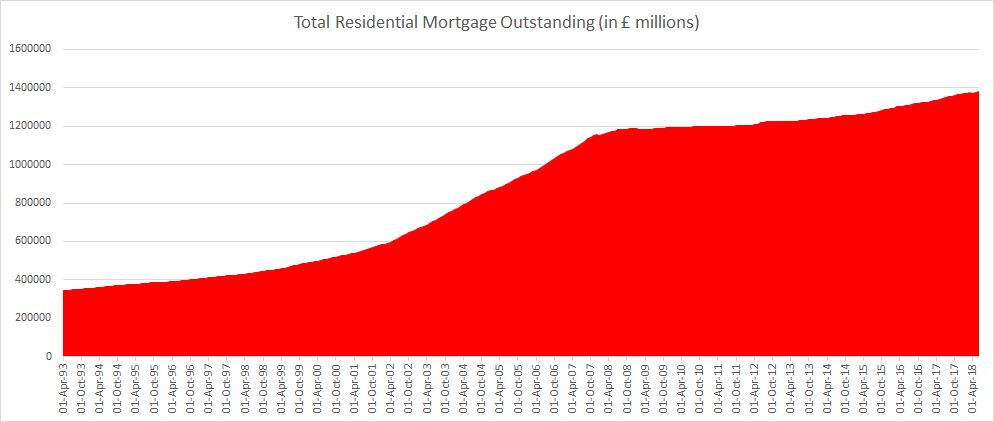
Mortgage debt outstanding currently stands at £1.38 trillion, up 16% from January 2008 (£1.16 trillion)
A few things:
1. Mortgage debt outstanding is just 20% of the total value of residential property today compared to 45% in mid-2019.
2. Interest rates remain close to record lows and slow and small interest rate hikes are unlikely to have a major impact on UK Households. (Read More: Impact of potentially higher interest rates on households in the UK)
Related:
UK house sales and house price growth are slowing but is this time any different?
Are the British obsessed about house buying and house prices?