It has been 10 years since the collapse of Lehman Brothers triggered the largest economic crash in living memory, how much has really changed since then? A lot has changed since then but not entirely as one would have expected …
Subscriptions is (apparently) the way to go
Forget buying a product, just subscribe or rent. At least that is what businesses want you to do.
Movies? Netflix
Music? Spotify
Car? Uber
Meal Kit? Blue Apron, Hello Fresh
Microsoft Office? Office 365
Furniture? Feather
Shaving Equipment? Dollar Shave Club
And even … Toothbrush? Quip
What else is possibly there to rent? Even everyday clothes are now available as a subscription service. As retail stores selling products are closing, subscription services are thriving. But seriously, toothbrush subscriptions?
Banks in the United States can’t find enough customers to lend money to
Since the financial crisis of 2008-2009 the difference between bank deposit growth and bank loan growth in the U.S. diverged in a big way,
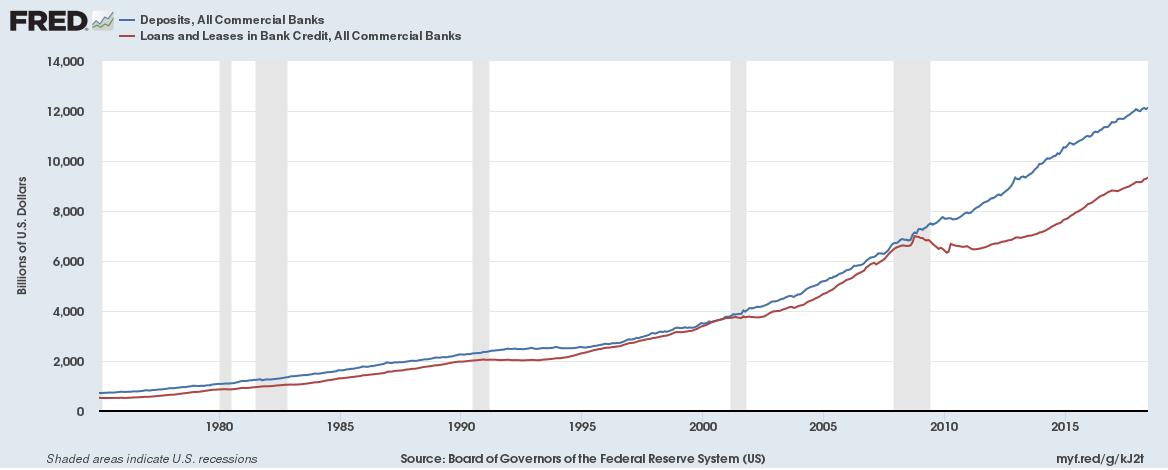
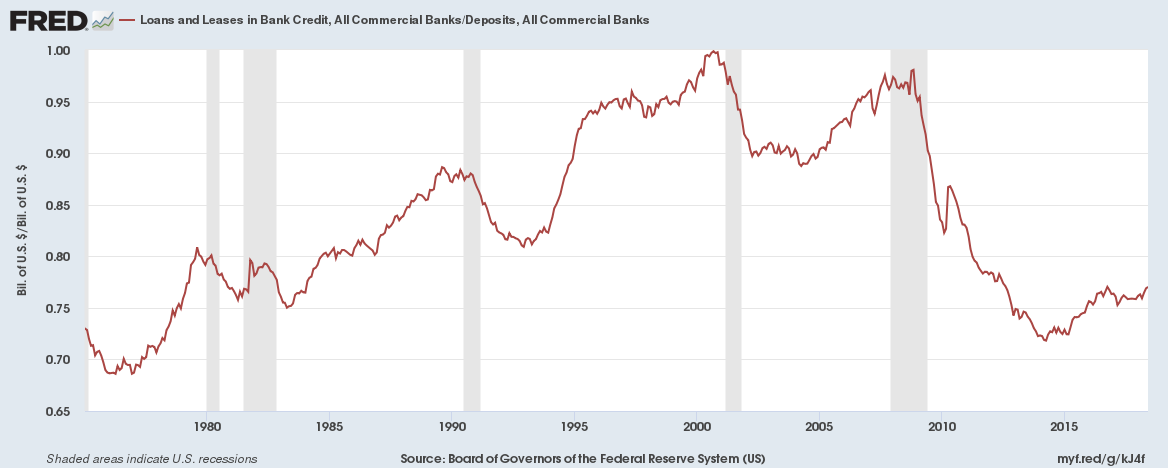
The loans to deposits ratio has fallen to a low of 0.77
And the liabilities to assets is close to a record low at 0.89
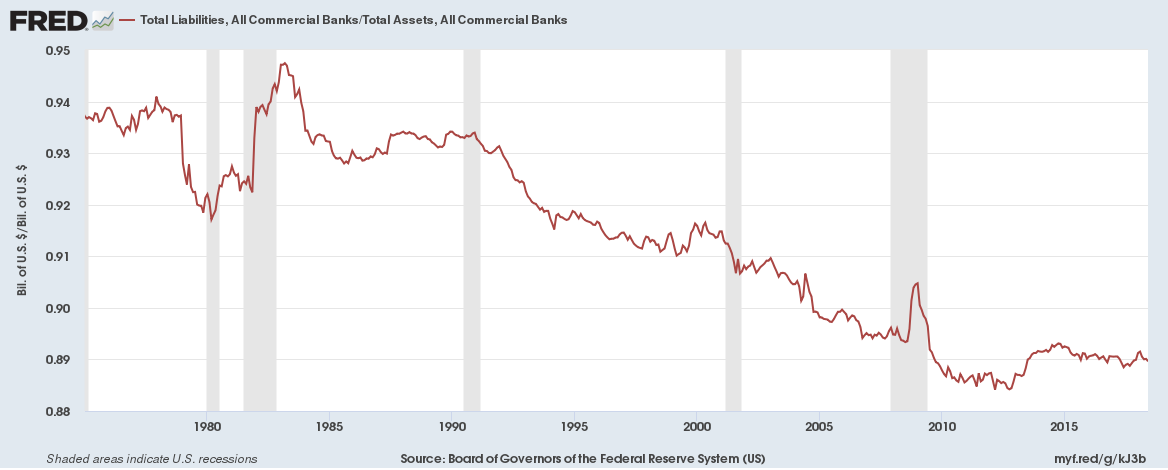
Read More: Banks in the United States have a problem – they can’t find enough customers to lend money to
Central Banks have become big buyers of stocks
Both the Swiss National Bank and the Bank of Japan have negative interest rates (-0.75% for Switzerland and -0.10% for Japan) and have done a lot of Quantitative Easing in the last 5 years. Both have a balance sheet greater than the GDP of their respective countries with Bank of Japan’s balance sheet 101% of GDP of Japan and the Swiss National Bank with a balance sheet of 125% of GDP of Switzerland. What do they do with freshly printed money?
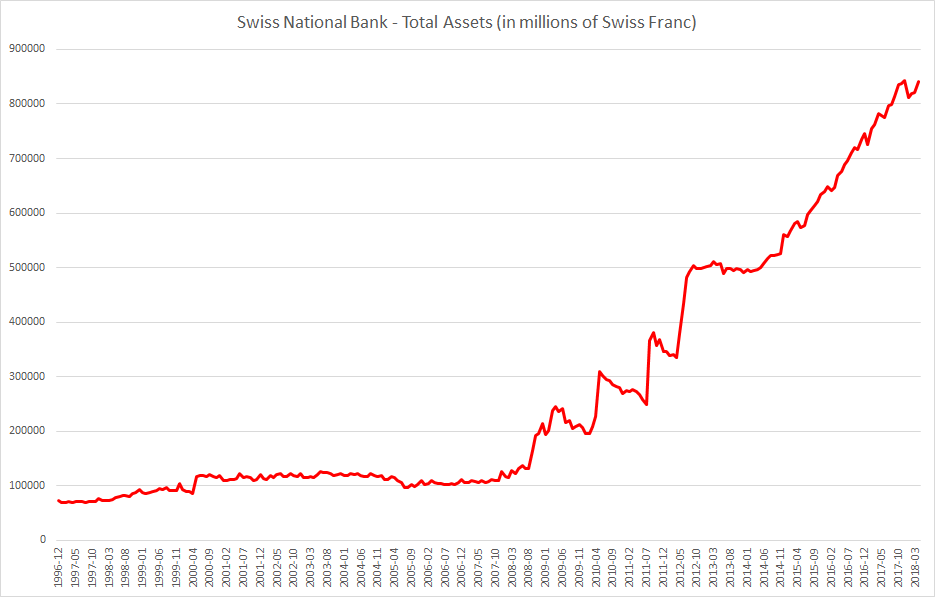
The Swiss National Bank has around $800 billion in foreign currency investments. Amongst its famous holdings are a $3 billion investment in Apple (and it has been buying more shares) and $1.5 billion investment in Facebook. It made a profit of 54 billion Swiss Francs ($55 billion) for the 2017 financial year mainly down to its overseas stock investments.
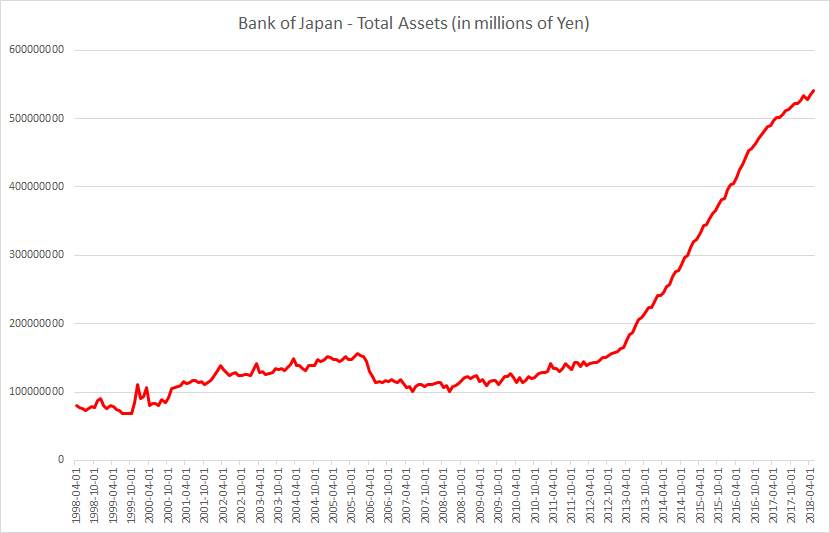
The Bank of Japan has a target to buy 6 trillion Yen ($54 billion) worth of exchange traded funds a year. It now holds almost 82% of all ETFs in Japan and is indirectly the largest shareholder in many large Japanese companies, almost about half of listed companies.
Central Banks don’t just manage monetary policy now, they are also major shareholders in private corporations.
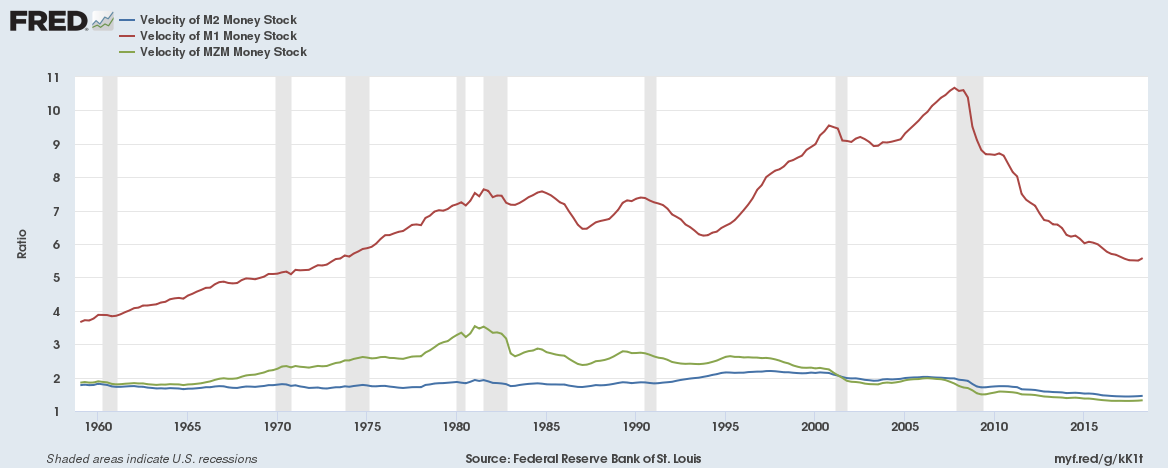
Money Velocity is at record lows
The velocity of money is the frequency at which one unit of currency is used to purchase domestically- produced goods and services within a given time period. In other words, it is the number of times one unit of money is spent to buy goods and services per unit of time. If the velocity of money is increasing, then more transactions are occurring between individuals in an economy. If it is decreasing, then fewer economic transactions are taking place.
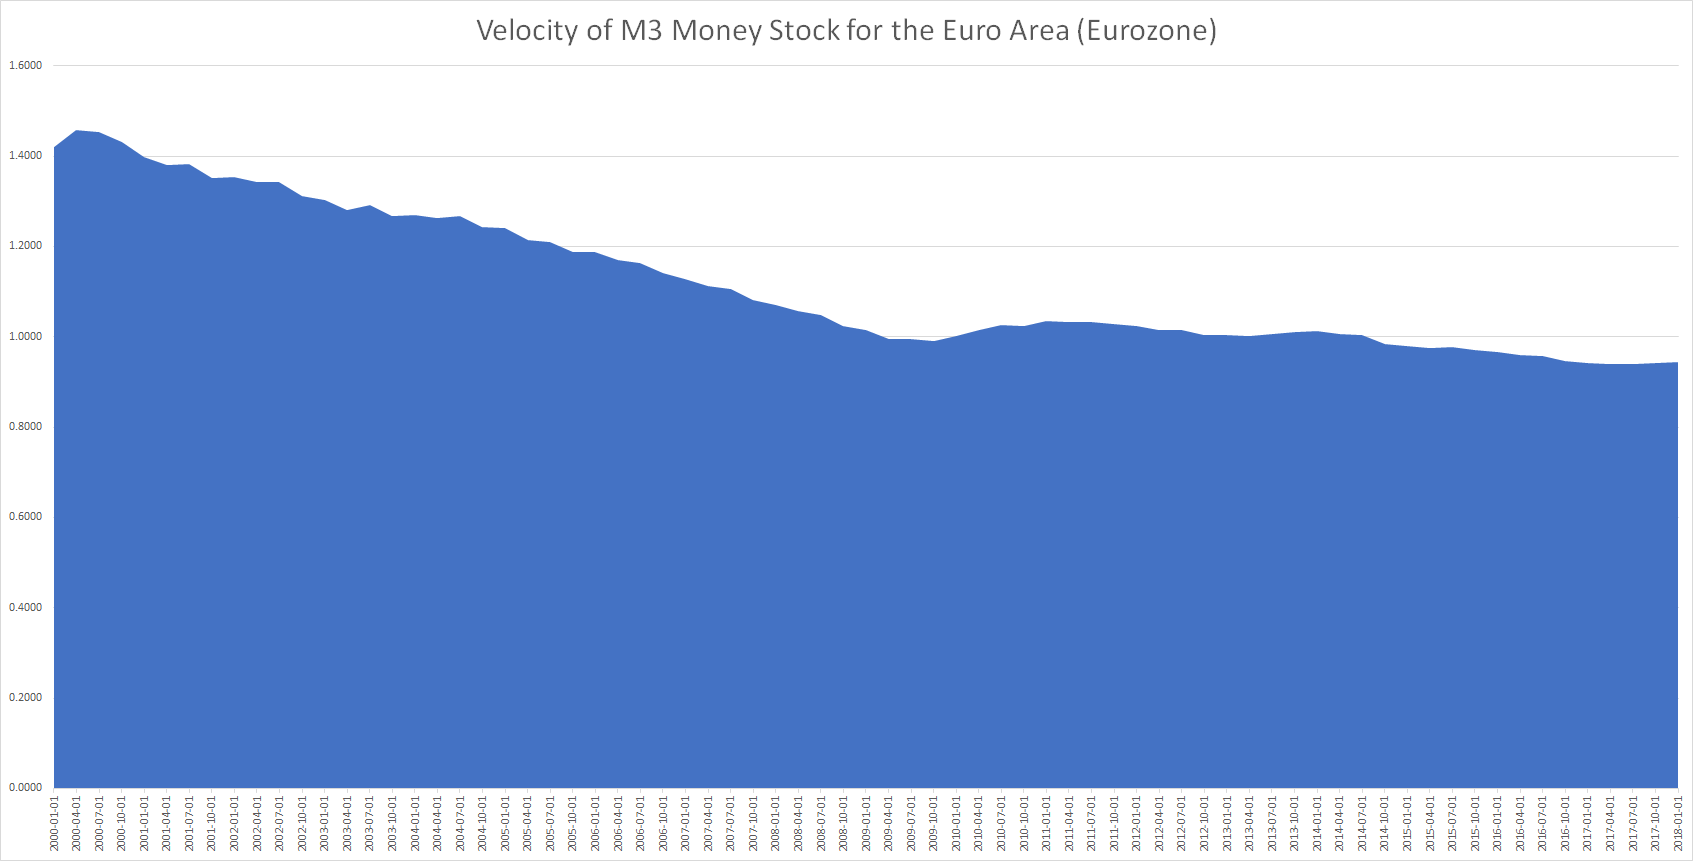
Money velocity is close to record lows in the United States and the Euro Area or Eurozone
Read More:
The curious case of low U.S. money velocity
Euro Area or Eurozone Money Velocity seems to be shockingly low
Broad Money Supply M3 has soared in the past decade
Broad money (M3) includes currency, deposits with an agreed maturity of up to two years, deposits redeemable at notice of up to three months and repurchase agreements, money market fund shares/units and debt securities up to two years. Broad Money Supply has grown significantly over the past decade. Quantitative Easing in fully glory …
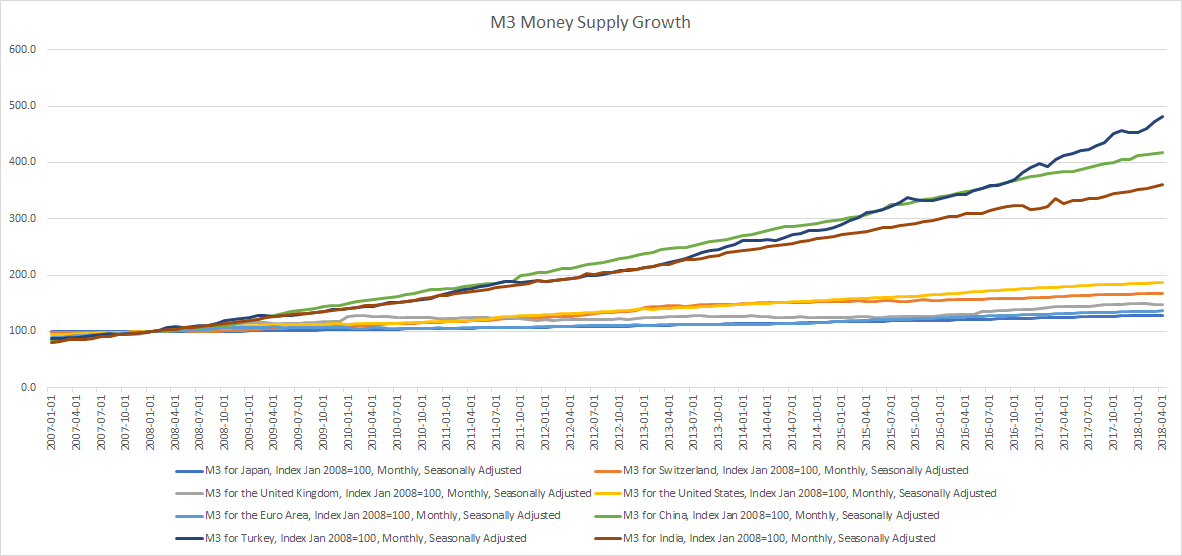
Read More: Here’s how much money supply has grown for major economies in the past decade (2008 to 2018)
Some things never change, they just become different. This time it is different.