We couldn’t find any official Money Velocity numbers for the Euro Area (Eurozone) so calculated it using the Equation of Exchange
Equation of Exchange
MV=PQ
Money Supply (M) * Money Velocity (V) = Price level (P) * Real economic output (Q)
Which means Money Supply * Money Velocity = Nominal GDP
Therefore, Money Velocity = Nominal GDP/Money Supply
We have the numbers for both Money Supply (from OECD – Organization for Economic Co-operation and Development) and Nominal GDP (from Eurostat) for the Euro Area.
Money Velocity
The velocity of money is the frequency at which one unit of currency is used to purchase domestically- produced goods and services within a given time period. In other words, it is the number of times one Euro is spent to buy goods and services per unit of time. If the velocity of money is increasing, then more transactions are occurring between individuals in an economy.
The frequency of currency exchange can be used to determine the velocity of a given component of the money supply, providing some insight into whether consumers and businesses are saving or spending their money.
Money Supply or Money Stock (we have considered M3)
Broad Money M3: Broad money (M3) includes currency, deposits with an agreed maturity of up to two years, deposits redeemable at notice of up to three months and repurchase agreements, money market fund shares/units and debt securities up to two years.
Here are our calculations,
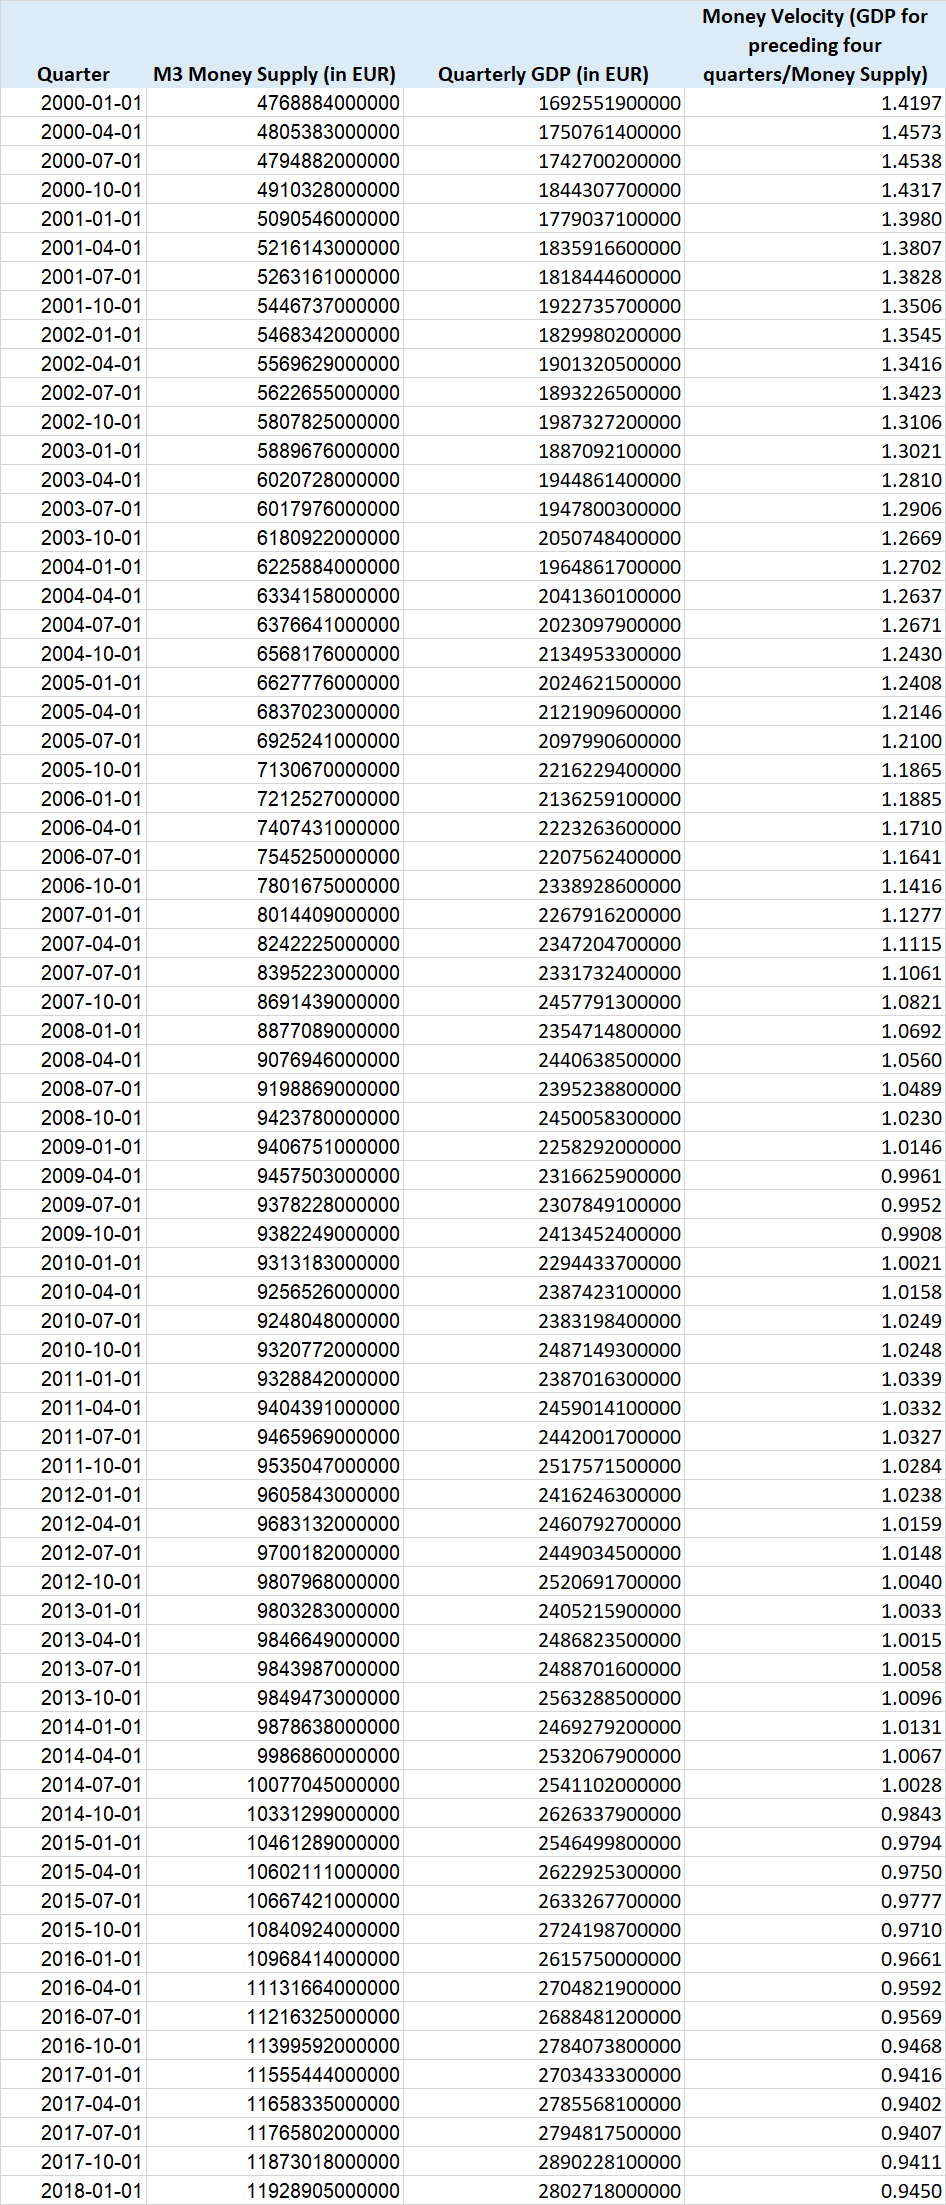
And a graph,
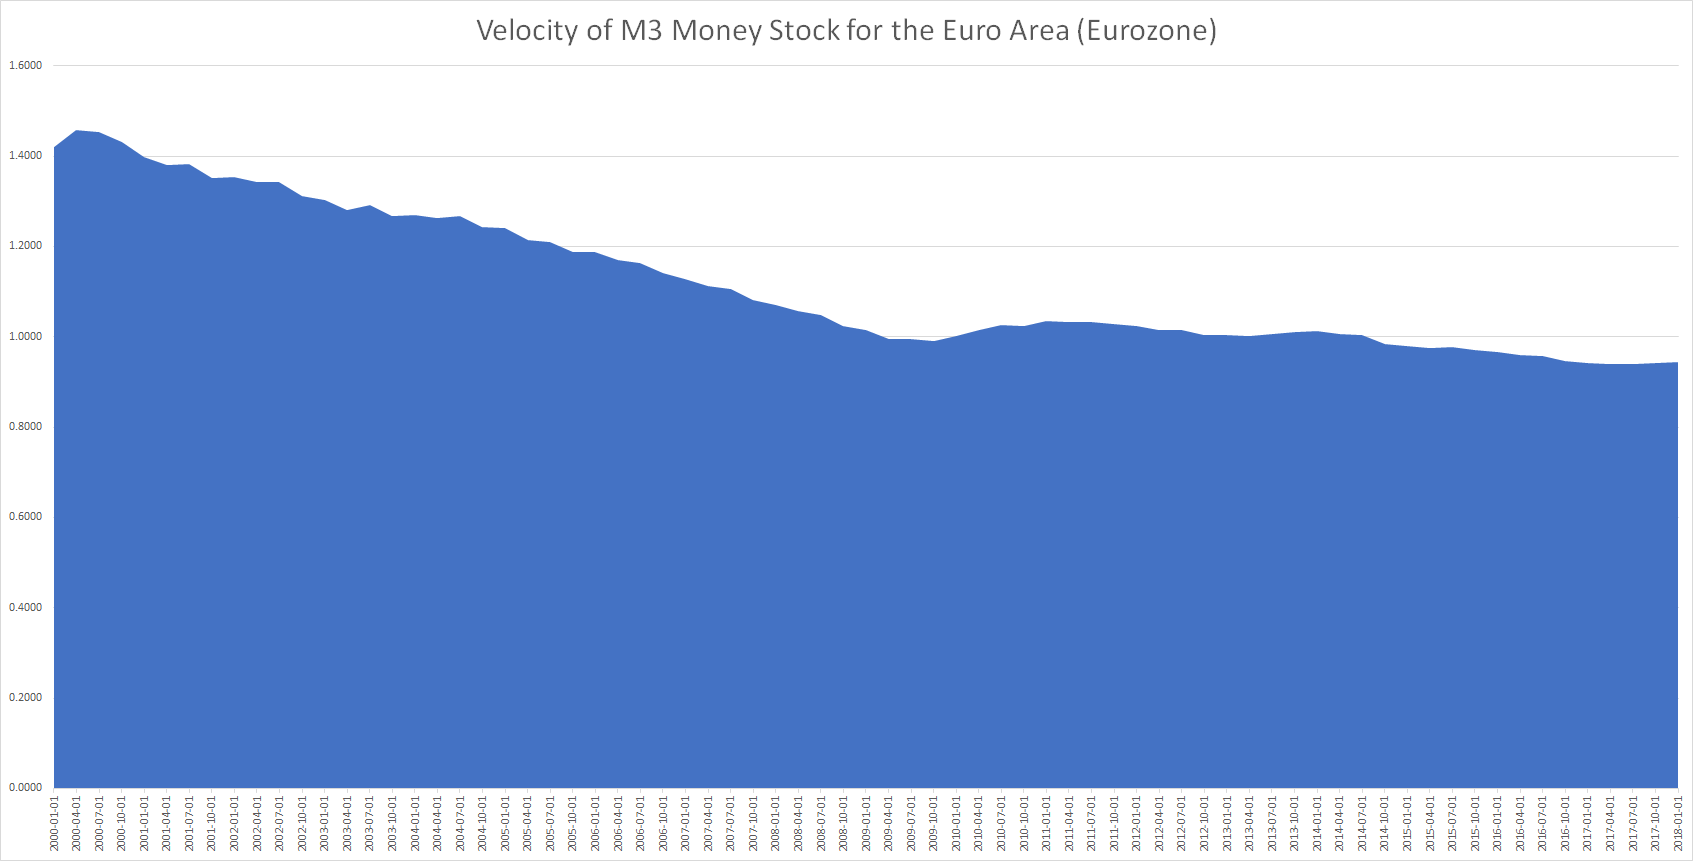
Money velocity in the Euro Area is currently less than 1 which means that money being printed (even notionally) isn’t even circulating once.
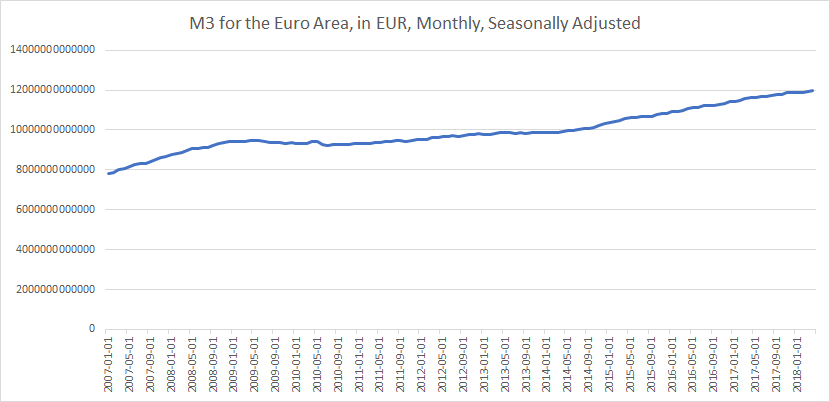
M3 Money Stock or Money Supply for the Euro Area is bigger than the GDP of the Euro Area and is at a record high of over 12 Trillion Euros,
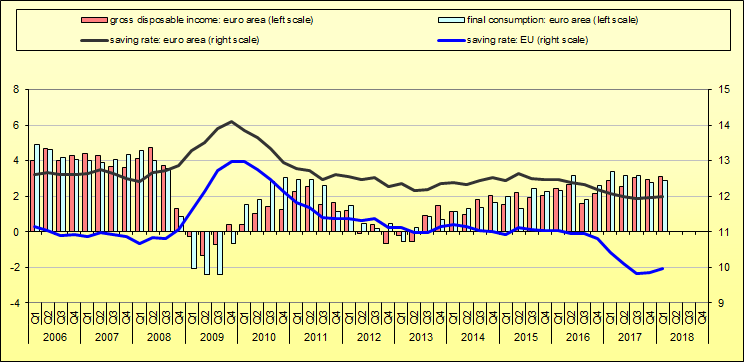
One could claim individuals and businesses/private sector are hoarding money instead of spending it. Well on the individual or household side of things we know the savings rate is the lowest in over a decade,
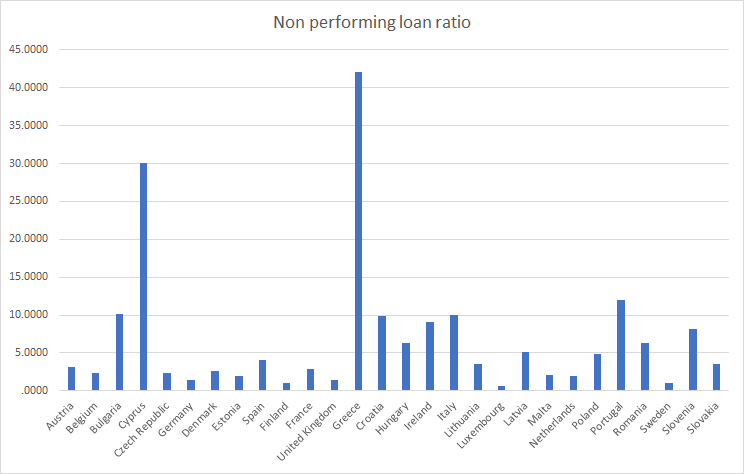
And banks are being conservative in lending because of the high bad loan rate,
Given that money velocity is so low now implies
1. Consumer and business confidence for spending isn’t particularly high.
2. Consumers and businesses aren’t borrowing too much money either.
3. There is ample (probably excessive) liquidity in the system, another side effect of years of Quantitative easing. Money supply has grown far quicker than nominal GDP.
Related:
The curious case of low U.S. money velocity
Here’s how much money supply has grown for major economies in the past decade (2008 to 2018)
The European banking crisis is far from over
The ECB balance sheet is now over 4.5 trillion Euros, some 45% of Eurozone GDP