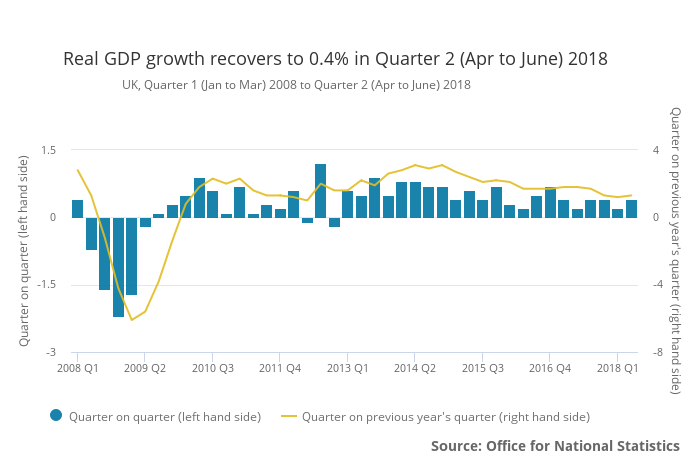
UK GDP in volume terms was estimated to have increased by 0.4% between Q1 2018 and Q2 2018. GDP rose by 1.3% in Q2 2018 compared with the same quarter a year ago.
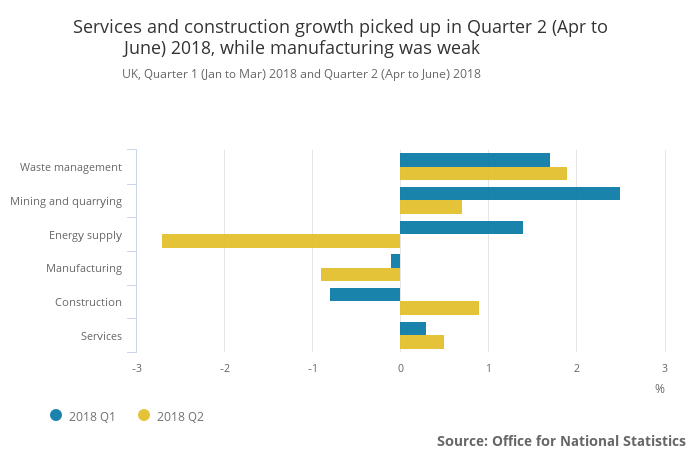
Services and construction growth picked up while manufacturing was weak
The services industries and construction increased in Q2 2018, by 0.5% and 0.9% respectively; while production decreased by 0.8%.
The output measure of GDP grew by 0.4% in Q2 2018, driven by stronger growth in both the services and construction industries. These rises were offset by a fall in production, driven by manufacturing and energy supply, while growth in both mining and quarrying, and waste management continued.
The quarterly decline in manufacturing primarily reflected a weak April outturn, with output falling by 1.2% in the month, before recovering to rise by 0.6% in May and 0.4% in June. This marks the second consecutive quarterly decline in manufacturing output, which has not been seen since Q1 2016.
The pickup in services growth in Q2 2018 was driven primarily by stronger growth in wholesale and retail trade, and transport, storage and communications.
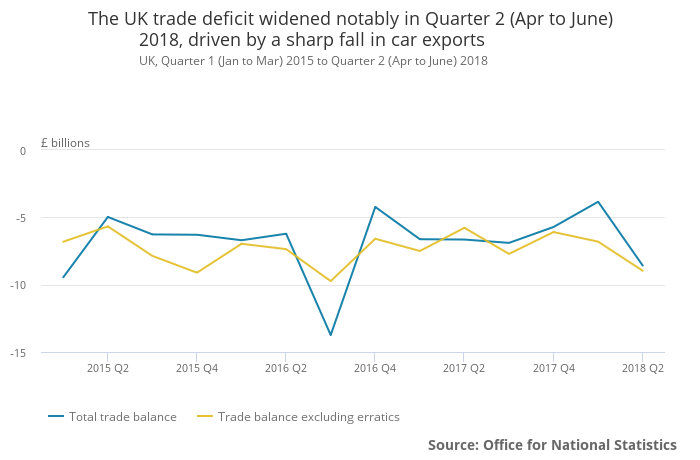
Trade deficit widens
The UK trade deficit widened notably in Q2 2018, driven by a sharp fall in car exports. The trade deficit widened by £4.7 billion in Q2 2018 (in current price terms), with net trade dragging on GDP growth as a result.
Wage growth slowing
Growth in compensation of employees slowed to 0.6% in Q2 2018, which was the weakest growth since Q4 2016. This slowdown reflected weaker growth in wages and salaries, offset by stronger growth in employers’ social contributions.
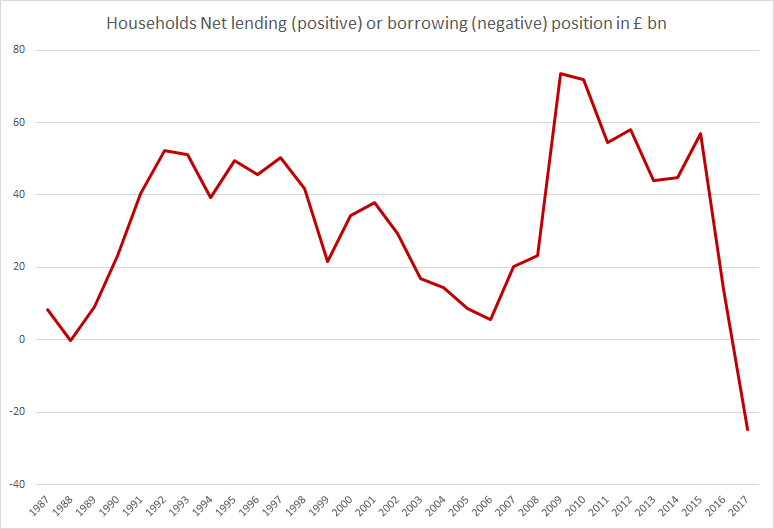
UK households have seen their outgoings surpass their income for the first time in nearly 30 years
Households in the United Kingdom have seen their outgoings surpass their income for the first time in nearly 30 years as per a release from the Office for National Statistics.
On average, each UK household spent or invested around £900 more than they received in income in 2017. The total amounted to almost £25 billion for all households in the UK. Households’ outgoings last outstripped their income for a whole year in 1988, although the shortfall was much smaller at just £0.3 billion back then.
The country did not reach a point where the average household was a net borrower even in the run-up to the financial crisis of 2008 and 2009 – when 100% (and more) mortgages were offered to home buyers without a deposit.
Read more here.
Related:
UK Q1 2018 GDP only increased by 0.1%, growth slowest since Q4 2012
U.S. Q2 2018 GDP estimated at 4.1% as personal consumption soars but wage growth collapses
UK house sales and house price growth are slowing but is this time any different?
UK households have seen their outgoings surpass their income for the first time in nearly 30 years
Impact of (potentially) higher interest rates on households in the UK
This is how wealthy UK households are (as per the Office for National Statistics)