Aggregate total net wealth of all households in Great Britain was £12.8 trillion in July 2014 to June 2016, up 15% from the July 2012 to June 2014 figure of £11.1 trillion.
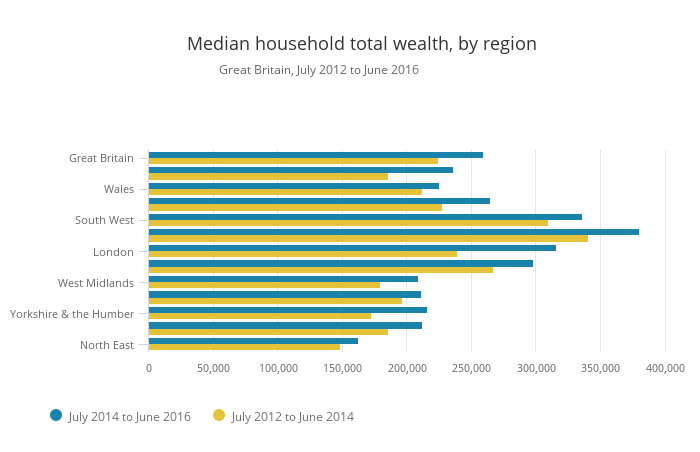
Median household total net wealth was £259,400 in July 2014 to June 2016, up from £225,100 in the previous period (an increase of 15%).

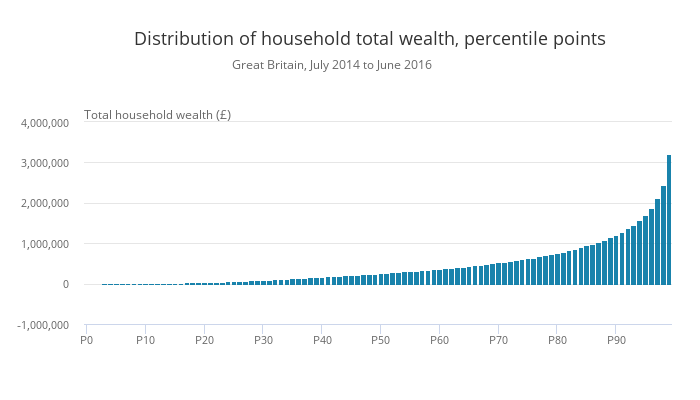
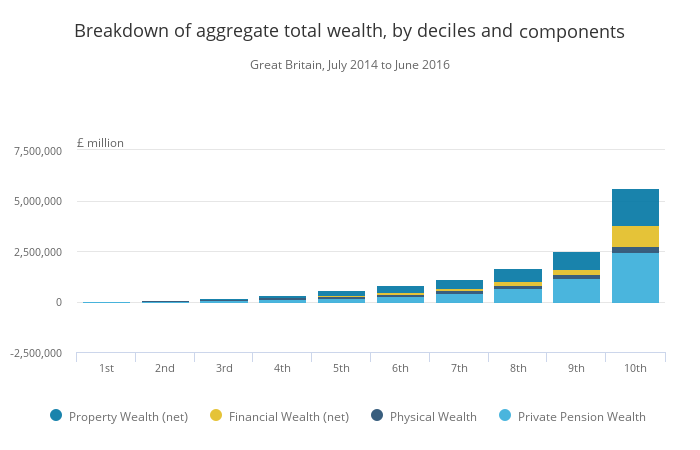
In July 2014 to June 2016, the wealth held by the top 10% of households was around five times greater than the wealth of the bottom half of all households combined.

In July 2014 to June 2016, aggregate total private pension wealth of all households in Great Britain was £5.3 trillion; this has increased from £4.4 trillion in July 2012 to June 2014.
In July 2014 to June 2016, 49% of individuals aged 16 to 64 years had some form of active private pension that they were contributing to (up from 44% in the previous period).
In July 2014 to June 2016, 66% of employees were actively contributing to a private pension scheme compared with 25% of self-employed, with median current pension wealth for employees being £33,000 compared with £21,000 for the self-employed.
There was a striking increase in the value of net property wealth for households in London compared with all other regions; median net property wealth in London was £351,000 in July 2014 to June 2016, a 33% increase from £263,000 in July 2012 to June 2014.
Total aggregate debt of all households in Great Britain was £1.23 trillion in July 2014 to June 2016 (a 7% increase from July 2012 to June 2014), of which £1.12 trillion was mortgage debt (6% higher) and £117.0 billion was financial debt (15% higher).
The South East remains the wealthiest; where half of all households had wealth of £380,600 or more in the period July 2014 to June 2016. The South East was followed by the South West and London, with median household total wealth of £336,400 and £316,600 respectively.
