Households in the United Kingdom have seen their outgoings surpass their income for the first time in nearly 30 years as per a release from the Office for National Statistics.
On average, each UK household spent or invested around £900 more than they received in income in 2017. The total amounted to almost £25 billion for all households in the UK. Households’ outgoings last outstripped their income for a whole year in 1988, although the shortfall was much smaller at just £0.3 billion back then.
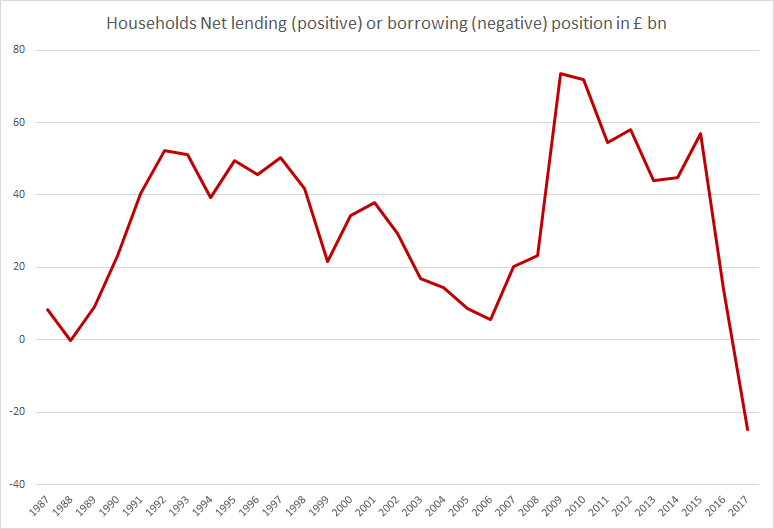
The country did not reach a point where the average household was a net borrower even in the run-up to the financial crisis of 2008 and 2009 – when 100% (and more) mortgages were offered to home buyers without a deposit.
Living beyond their means for making ends meet?
To fund this shortfall, households must either borrow or dip into their savings.
Households took out nearly £80 billion in loans last year, the most in a decade but they deposited just £37 billion with UK banks, the least since 2011.
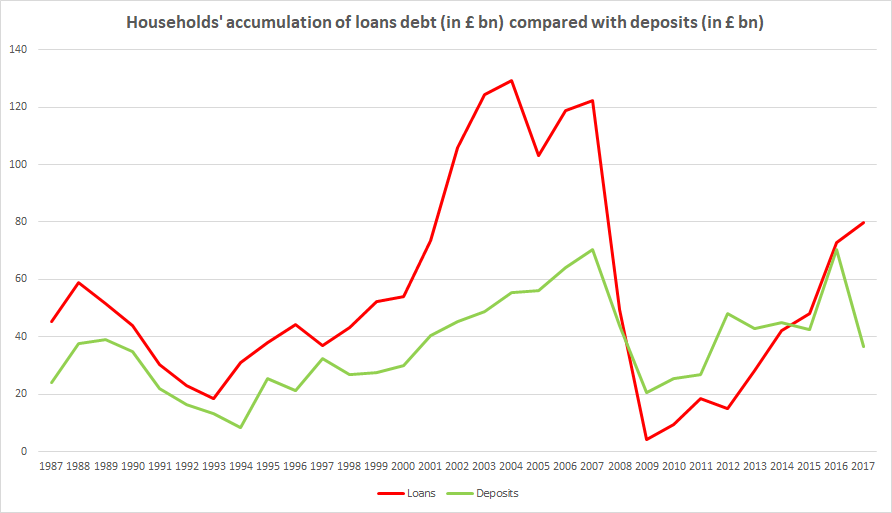
In total, households accumulated more debt (mainly due to loans) than assets (such as deposits, bonds, shares and pensions) in 2017 for the first time since records began in 1987.
Interest Rates to blame?
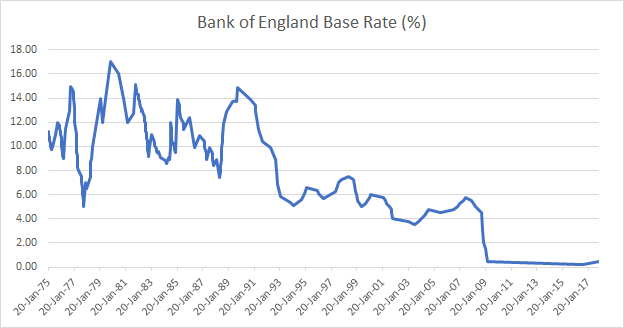
Are households borrowing more and saving less because of low interest rates? Interest rates have been at or near a record low for the past decade.
The base rate set by the Bank of England is just 0.5%, compared with almost 15% in 1990, making financial conditions better for borrowers rather than savers.
Expectations of an interest rate rise can affect saving and borrowing behaviour. Borrowing could rise in the short-term as households seek to take advantage of smaller repayments, while saving could be put off amid the prospect of higher returns in future.
How does the spending vs saving rate compare to other countries?
The average household in Canada and the US have been in the red for at least some of the last two decades, with hardly any disposable income left over to save once spending and taxes are accounted for.
Meanwhile, the average household in Germany and France has always been able to cover their outgoings without turning to debt, partly because they’re historically bigger savers than the UK, Canada and the US.
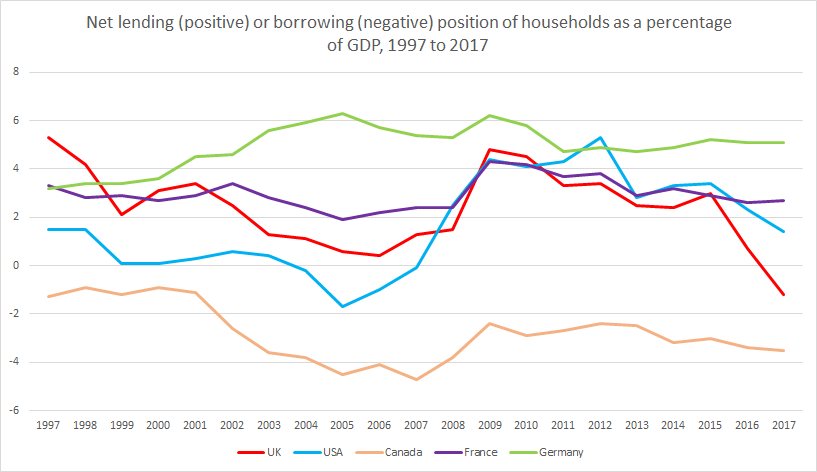
For a long time, the average UK household was in a similar position to those in France and Germany. But this time it is different, the average UK household is now much closer to those in Canada and the US than their European neighbours.
Related:
UK house sales and house price growth are slowing but is this time any different?
This is how wealthy UK households are (as per the Office for National Statistics)
Impact of (potentially) higher interest rates on households in the UK