Europe’s lost economic decade in charts

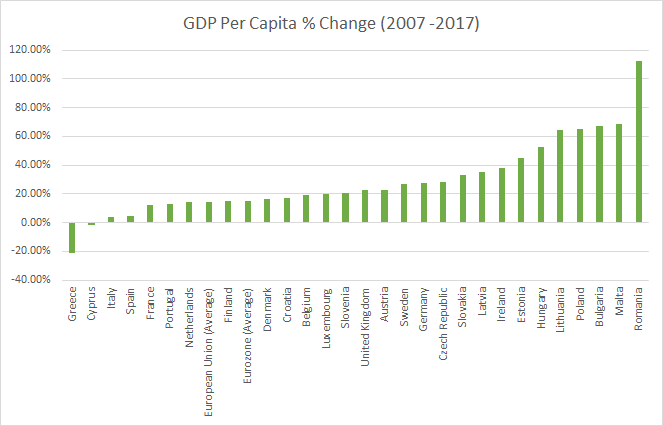
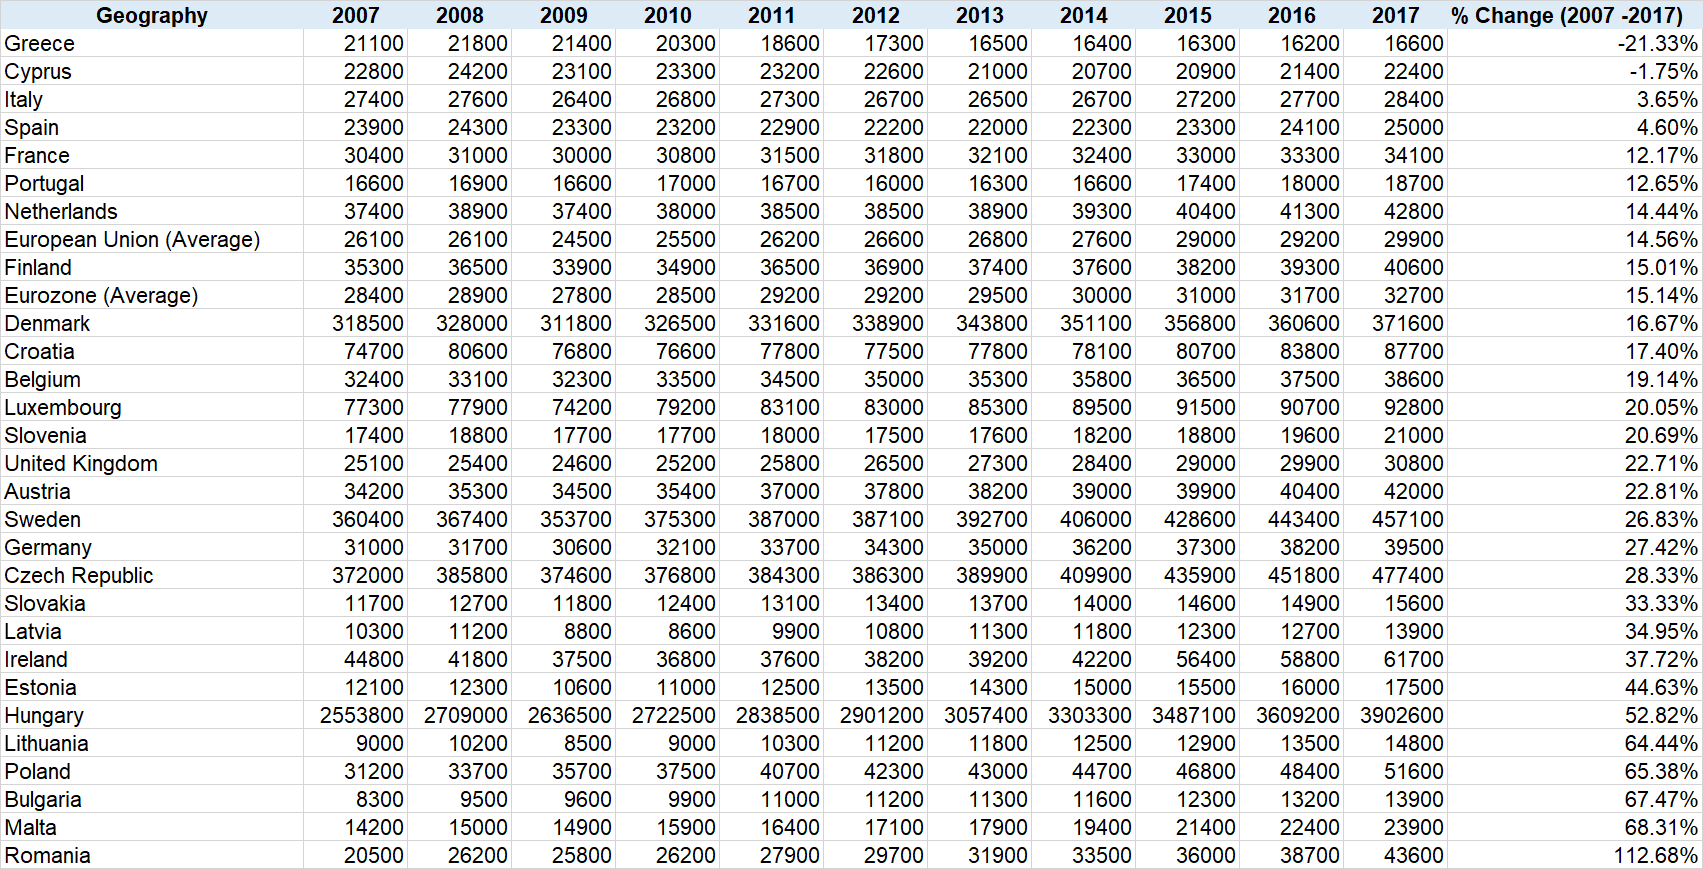
  • Parts of the European Union have seen GDP per capita shrink between 2007 and 2017 and the overall compounded annual growth rate for the European Union was just 1.2%
  • GDP growth for the European Union between 2007 and 2017 adjusted for inflation was negative
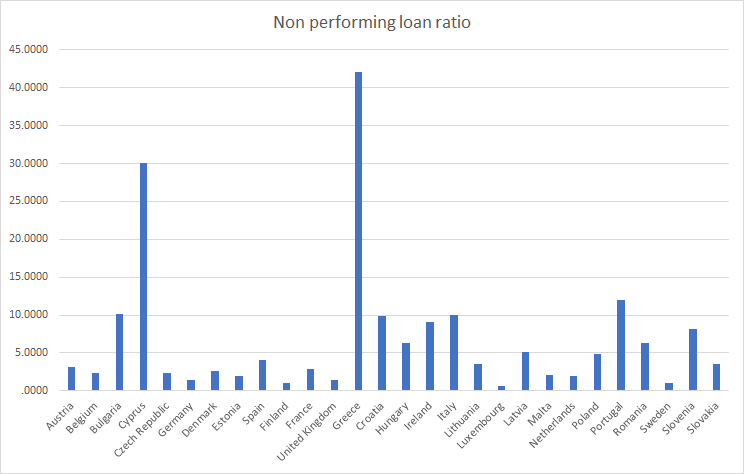
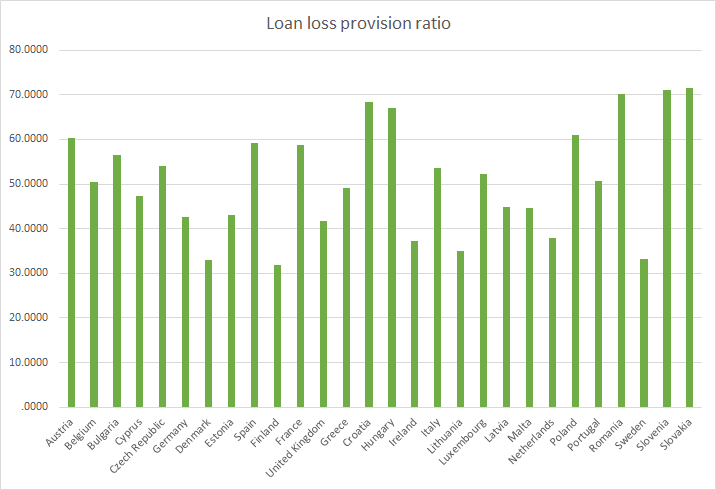
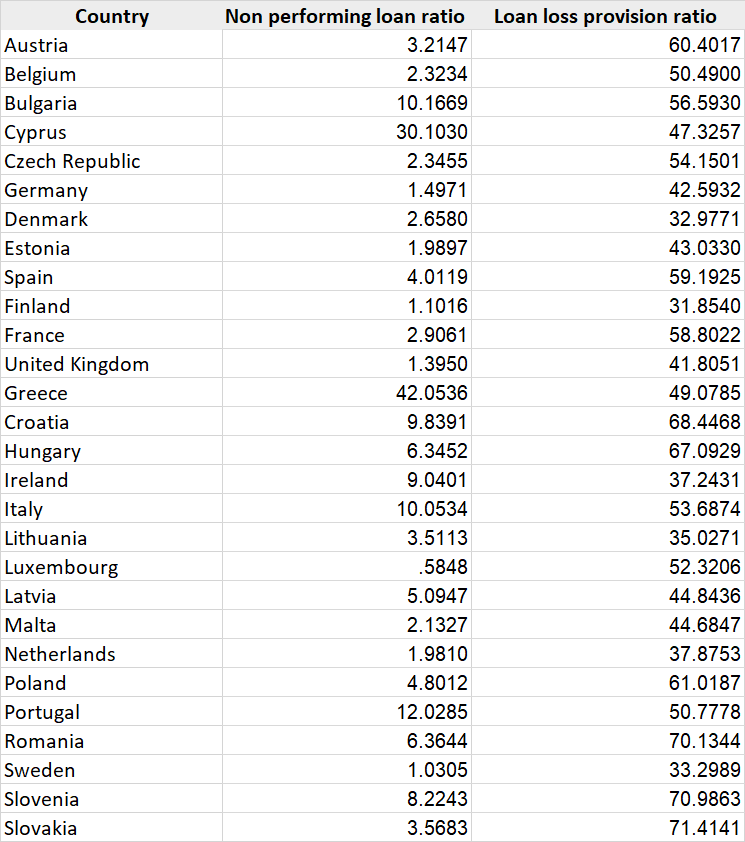
  • Banks in Greece, Cyprus, Portugal and Italy have a non-performing loan ratio of over 10% a decade on from the financial crisis and have only provisioned around 50% of the losses
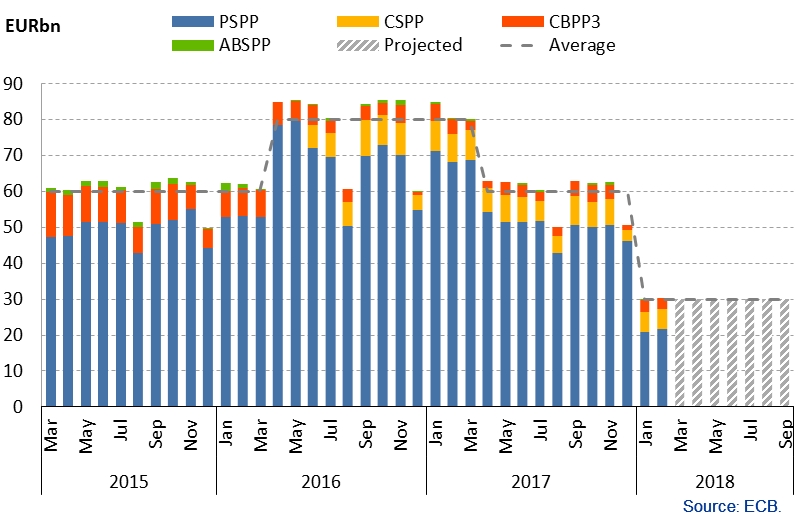
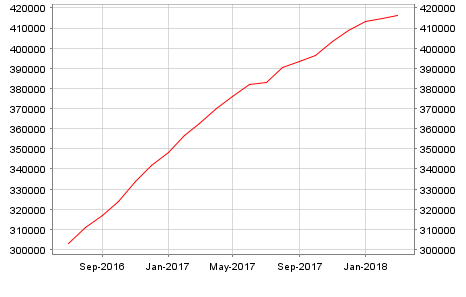
  • The European Central Bank (ECB) is by far the biggest holder of European bonds and has a balance sheet of €4.5 trillion or some 45% of the GDP of the Eurozone
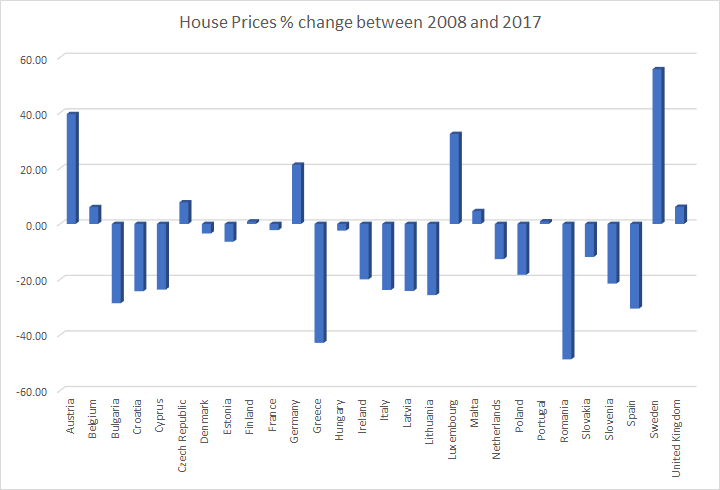
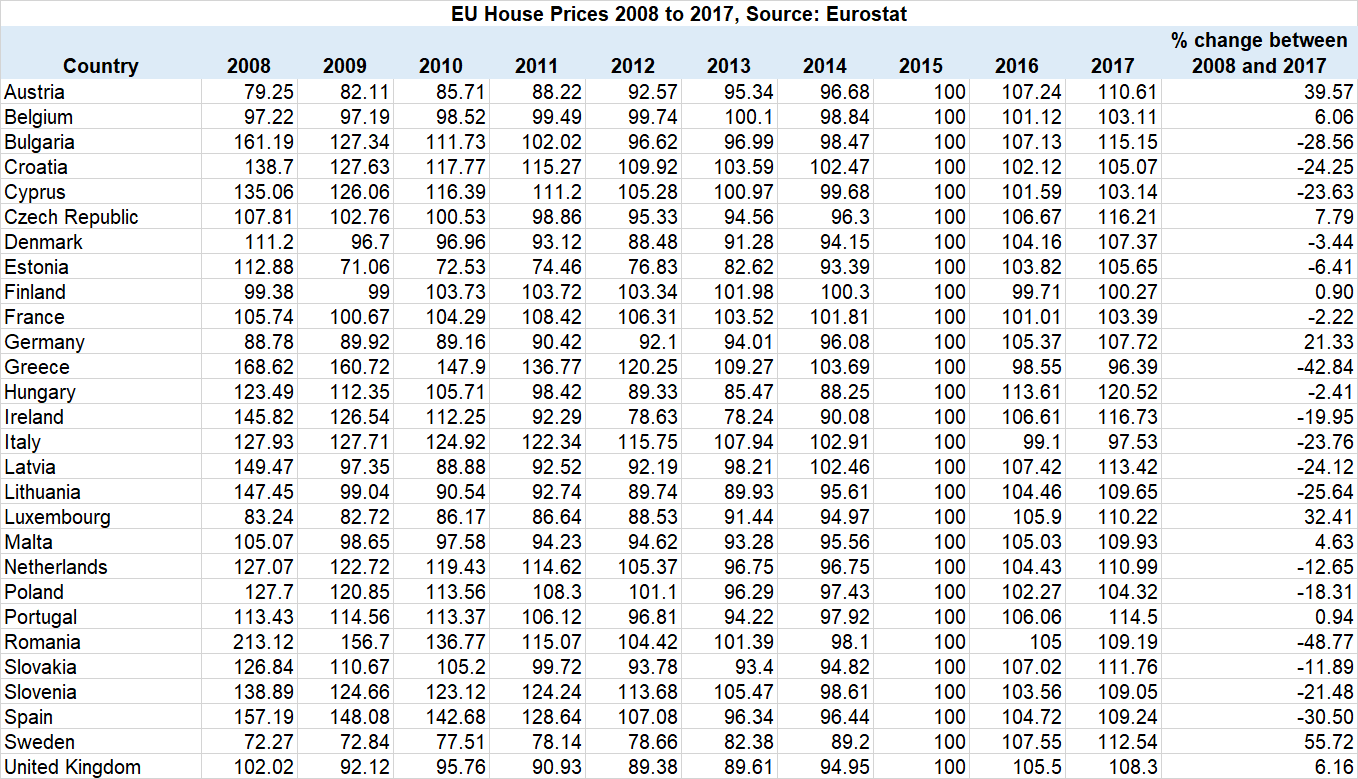
  • 18 of the 28 countries that are part of the European Union have seen house prices fall between 2008 and 2017
  • Greece has been the worst affected country, with its stock market down 85% since 2007, GDP per capita down 22% since 2007, house prices down 43% since 2008 and banks in Greece currently have a non-performing loan ratio of 42%
  • Eurozone Debt as % of GDP is gradually falling but is still historically high
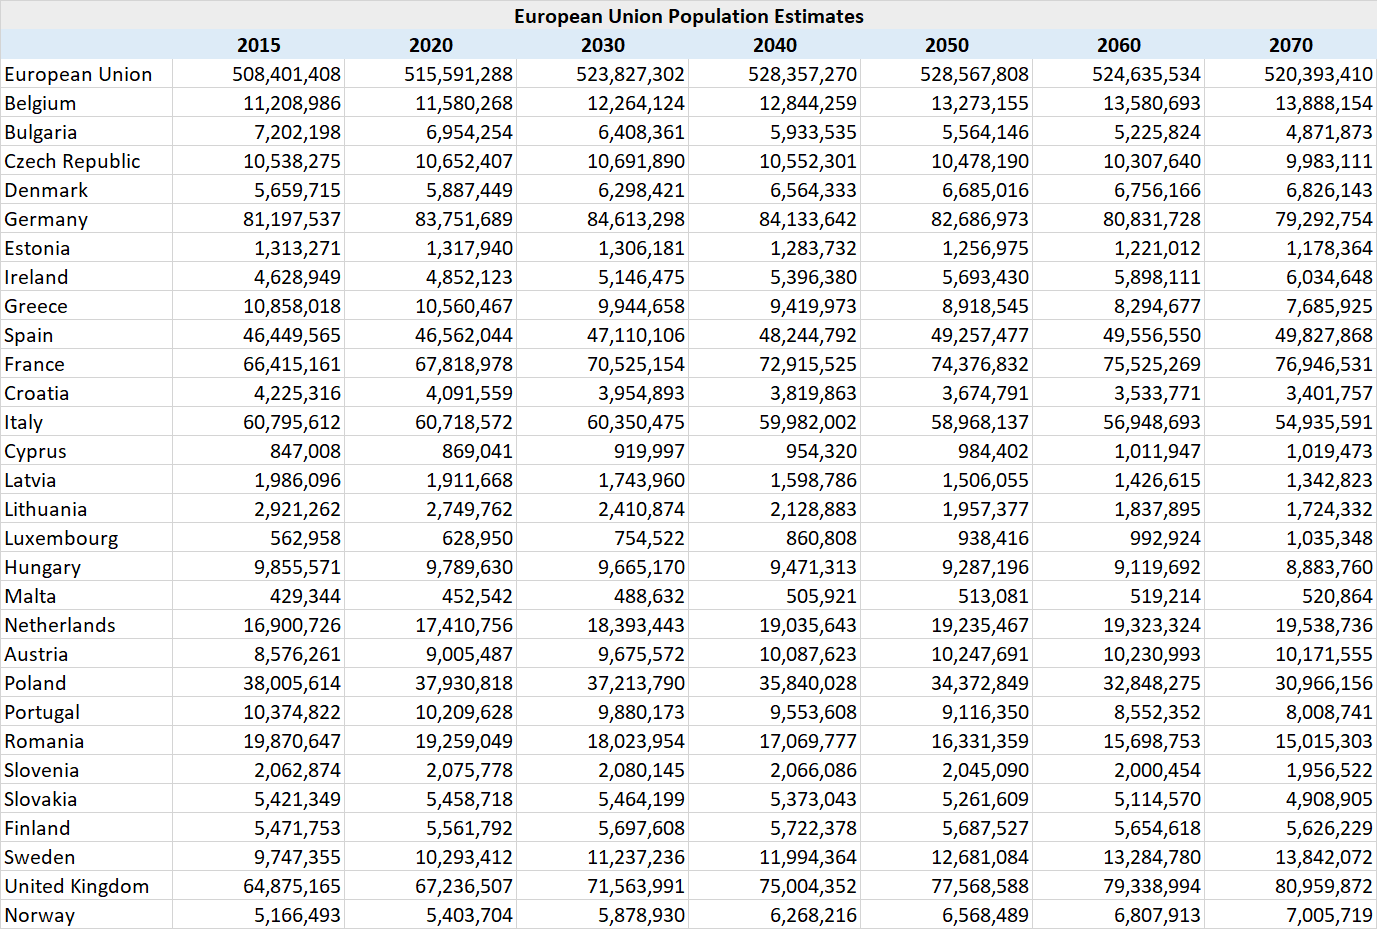
  • Since the financial crisis of 2008, economic uncertainty has seen falling fertility rates for the European Union with population now set to fall over the coming decades


GDP per capita (Read more here)

EU GDP Per Capita 2007 to 2017
Data Source: Eurostat
EU GDP Per Capita 2007 to 2017
EU GDP Per Capita (in national currency) 2007 to 2017, Source: Eurostat

Non-performing loans (Read more here)

EU Non performing loan ratio
Source: European Central Bank; Data as of September 30, 2017
EU Loan loss provision ratio
Source: European Central Bank; Data as of September 30, 2017
EU Asset Quality
Source: European Central Bank; Data as of September 30, 2017

ECB Balance Sheet (Read more here)

ECB bond purchases
Asset purchase programme monthly net purchases, source ECB
Total assets of the European Central Bank
Total assets of the European Central Bank (in millions of €), Source: European Central Bank


European House prices (Read more here)
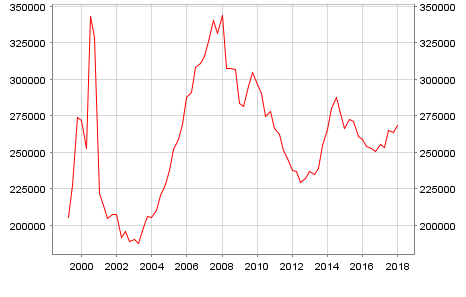
EU house price change 2008 to 2017, Source: Eurostat

Greece

Greece Household Assets
Greece Household Assets (in millions of €), Source: European Central Bank

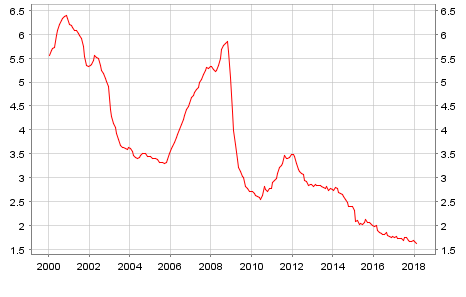
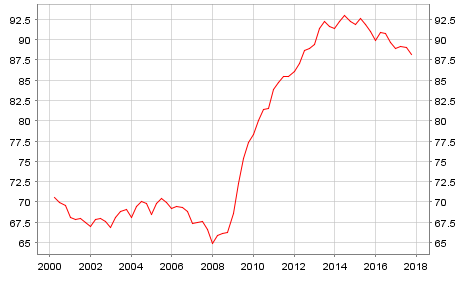
Eurozone Mortgage Rates

Mortgage Rates in the EU area
Mortgage Rates (%) in the EU area, Source: European Central Bank

Eurozone Debt as % of GDP (Read more here)

Euro Area Government debt as % of GDP
Euro Area Government debt as % of GDP, Source: European Central Bank

Population Estimates

EU population growth estimates
EU population growth estimates, Source: Eurostat

Leave a Reply

Your email address will not be published. Required fields are marked *

This site uses Akismet to reduce spam. Learn how your comment data is processed.