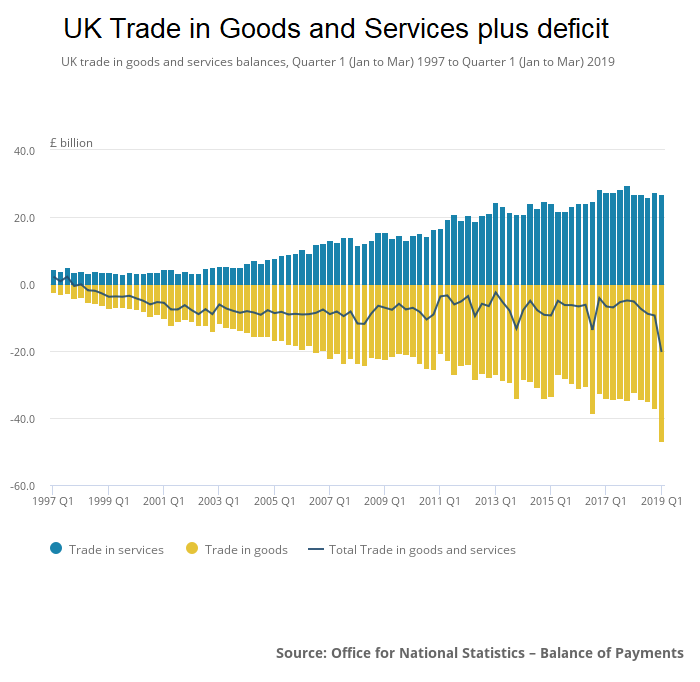
The story of UK trade with the European Union for the last two decades

We have been publishing a number of statistics for the United Kingdom and the European Union over the last few weeks in the run up to a major piece we will be publishing on the real economics of Brexit. This is the final piece before we publish our post on the real economics of Brexit.

How reliant is the United Kingdom on the European Union for trade? The answer to that is around 52% in 2017 (down from 59% in 1998 and 55% in 2008). 48% of UK exports go the European (EU) Union but 55% of UK imports are from the European Union. Exports to the EU have been decreasing but imports have been increasing. 69% of the trade deficit of the United Kingdom can be attributed to trade with the European Union.

Continue reading “The story of UK trade with the European Union for the last two decades”

UK Trade Statistics for trade by each product (and split by EU and non-EU trade) plus interactive tool for trade by each country

We will be publishing a number of statistics for the United Kingdom (and the European Union) over the next few days in the run up to a major piece we will be publishing on the real economics of Brexit. In the meanwhile, here are trade statistics for trade by each product for the United Kingdom for 2017 (the latest full year of data available) sourced from the Office for National Statistics.

Continue reading “UK Trade Statistics for trade by each product (and split by EU and non-EU trade) plus interactive tool for trade by each country”

Here’s how the demographic and economic statistics look for candidate members of the European Union

We will be publishing a number of statistics for the United Kingdom (and the European Union) over the next few days in the run up to a major piece we will be publishing on the real economics of Brexit.

Montenegro, the former Yugoslav Republic of Macedonia, Albania, Serbia, Turkey, Bosnia and Herzegovina and Kosovo are countries on the road to join the European Union.

European Union Membership 2018
Compiled by thistimeitisdifferent.com


Continue reading “Here’s how the demographic and economic statistics look for candidate members of the European Union”

The European Union (and not China or the United States) accounted for the most trade in goods and services combined together

We will be publishing a number of statistics for the United Kingdom (and the European Union) over the next few days in the run up to a major piece we will be publishing on the real economics of Brexit.

The European Union (EU28 or EU) accounted for around one sixth of world trade in goods in 2016, with a 16.3% share of exports and a 15.0% share of imports. Turning to services the EU28’s contribution to world trade (mainly due to the United Kingdom which is leaving the European Union) was even greater, totalling 24.7% of exports and 21.1% of imports.

EU Share of total world trade
Data Source: Eurostat, the International Monetary Fund (IMF) and the World Trade Organization (WTO)

Continue reading “The European Union (and not China or the United States) accounted for the most trade in goods and services combined together”

UK Trade Statistics for trade by each country

We will be publishing a number of statistics for the United Kingdom over the next few days in the run up to a major piece we will be publishing on the real economics of Brexit. In the meanwhile, here are trade statistics for the United Kingdom for 2016 (the latest full year of data available) sourced from the Office for National Statistics.

The top 5 countries for total trade value were Germany (£95.67 billion), the United States (£84.09 billion), the Netherlands (£53.93 billion), China (£52.51 billion) and France (£44.40 billion)

UK total trade by country in 2016
Data Source: Office for National Statistics

Continue reading “UK Trade Statistics for trade by each country”