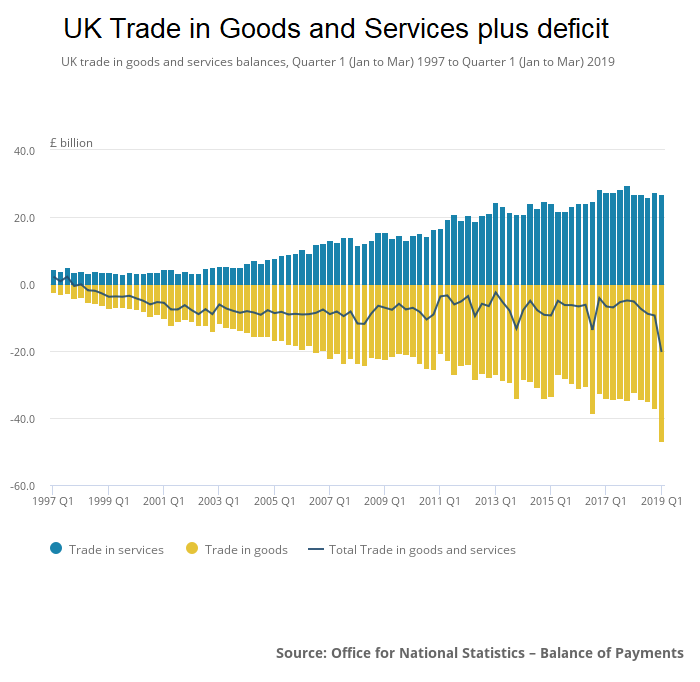
The United Kingdom’s trade deficit more than doubled to a record £20.3 billion in the first quarter (Q1) of 2019, or 3.7% of GDP. This was the fifth consecutive quarter of deterioration.
The last time the UK’s trade deficit was over 3% of GDP was in Q2 2002.

The widening of the total trade deficit was due to a worsening trade in goods deficit (of £10.1 billion) and a narrowing trade in services surplus (of £0.7 billion).
From another perspective, the total trade deficit widened as the increase of total imports (£12.5 billion) more than offset the increase in total exports (£1.6 billion).
As a result of the increases in both exports and imports, the value of total trade (the sum of total UK exports and imports) increased by 4.2% in Q1 2019 compared with the previous quarter, due mainly to volume growth on account of Brexit stockpiling. But the original Brexit deadline of March 29th 2019 was extended, what’s going to happen in October (the new deadline being October 31st)?
The increase in trade in Q1 2019 follows subdued global trade growth throughout 2018 where the UK’s total trade with the rest of the world, in volume terms, increased by only 0.4% – the slowest growth since 2008 when it fell by 8.4%.
Trade in goods
The value of goods imported increased by £12.1 billion in Q1 2019 due largely to increased imports of unspecified goods (including non-monetary gold), which rose by £9.9 billion.
Much of the increase in imports of unspecified goods was due to a rise of non-monetary gold. This was slightly offset by a £1.3 billion fall in imports of oil, mainly attributed to oil prices falling for a second consecutive quarter.
The value of goods exported increased by £2.0 billion in Q1 2019, due largely to increases in finished manufactured goods (of £2.7 billion), which includes products like ships, aircraft, telecoms and sound equipment. This was partly offset by a fall in exports of unspecified goods (of £1.0 billion) and a fall in the value of oil exported (of £0.8 billion) as oil prices fell for the second consecutive quarter.
Trade in services
The trade in services surplus narrowed by £0.7 billion to £26.8 billion in Q1 2019, equivalent to the average quarterly trade in services surplus throughout 2018. This slight narrowing was due to exports recording a fall of £0.4 billion to £73.2 billion and an increase of £0.3 billion in the imports of services.
Within exports of services, the largest falls were recorded in telecommunication, computer and information services (down £0.4 billion) and financial services (down £0.3 billion). These were slightly offset by a £0.4 billion increase in exports of intellectual property, attributed mainly to an increase in franchises and trademark licensing fees.
Within imports of services, the largest increase was recorded in other business (up £1.5 billion), particularly services between affiliated enterprises and recruitment services, partly offset by a fall in imports of financial services (down £0.5 billion) and travel services (down £0.3 billion).
Related:
The UK faces three immediate economic challenges irrespective of what happens with Brexit
Here are UK household spending insights
The UK’s net worth is now estimated at £10.2 trillion, an average of £155000 per person
This is how wealthy UK households are
UK households have seen their outgoings surpass their income for the first time in nearly 30 years
The UK economy a decade on from the 2008 recession
Nominal wages in the UK grew fastest in a decade but real wages are still lower than a decade ago