Here are insights into the spending habits of UK households by region and type of spending based on living costs and food survey of the Office for National Statistics.
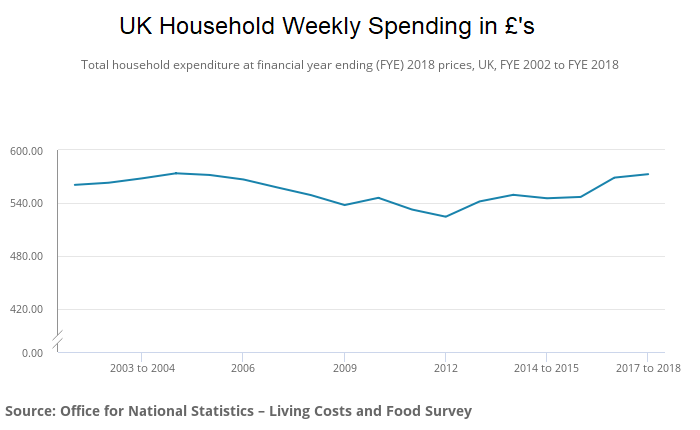
Average weekly household expenditure in the UK was £572.60 in the financial year ending 2018; the highest weekly spend since the financial year ending 2005, after adjusting for inflation.
Spending by region
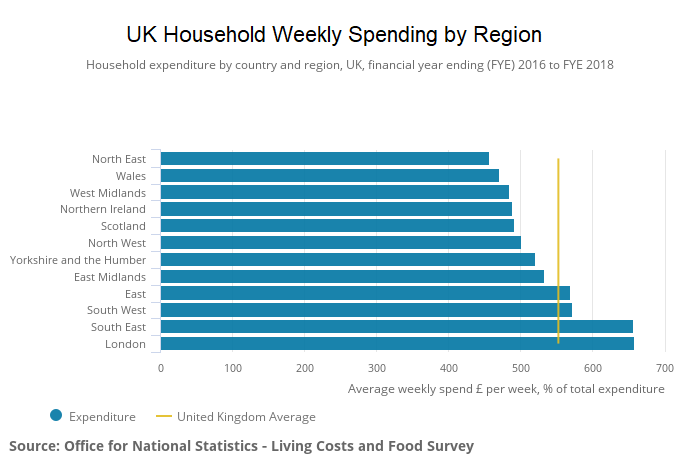
· Average weekly household spending was the highest in London and the South East (over £650), whilst spending in the North East was the lowest, approximately £200 less.
· The highest spending regions of England are London, where households spent an average of £658.30 a week, and the South East, where households spent an average of £657.50 a week; over £85 a week more than those in the next highest spending region, the South West.
· Whilst total spending in the top two regions is almost identical, the spending pattern differs considerably. Households in London spent 19% of their total expenditure on housing, fuel and power (£124.20 a week) whilst households in the South East spent only 12% of their total expenditure on this category (£77.40 a week).
· Following on from England, the second-highest spending UK constituent country was Scotland. Scottish households spent an average of £492.20 a week in FYE 2016 to FYE 2018. Whilst the top spending category for households in Scotland was recreation and culture, they spent a similar amount (£68.20 a week, 14% of total expenditure) on transport.
· Households’ in Northern Ireland spent an average of £488.50 a week in FYE 2016 to FYE 2018. Northern Ireland was the only country of the UK that had food and non-alcoholic drinks in its top three spending categories.
· Households’ in Wales had the lowest average weekly spending out of the four UK constituent countries for FYE 2016 to FYE 2018. Here, average weekly household spending was £470.40; this was £81.50 less than the UK average for this three-year time period.
Spending by category
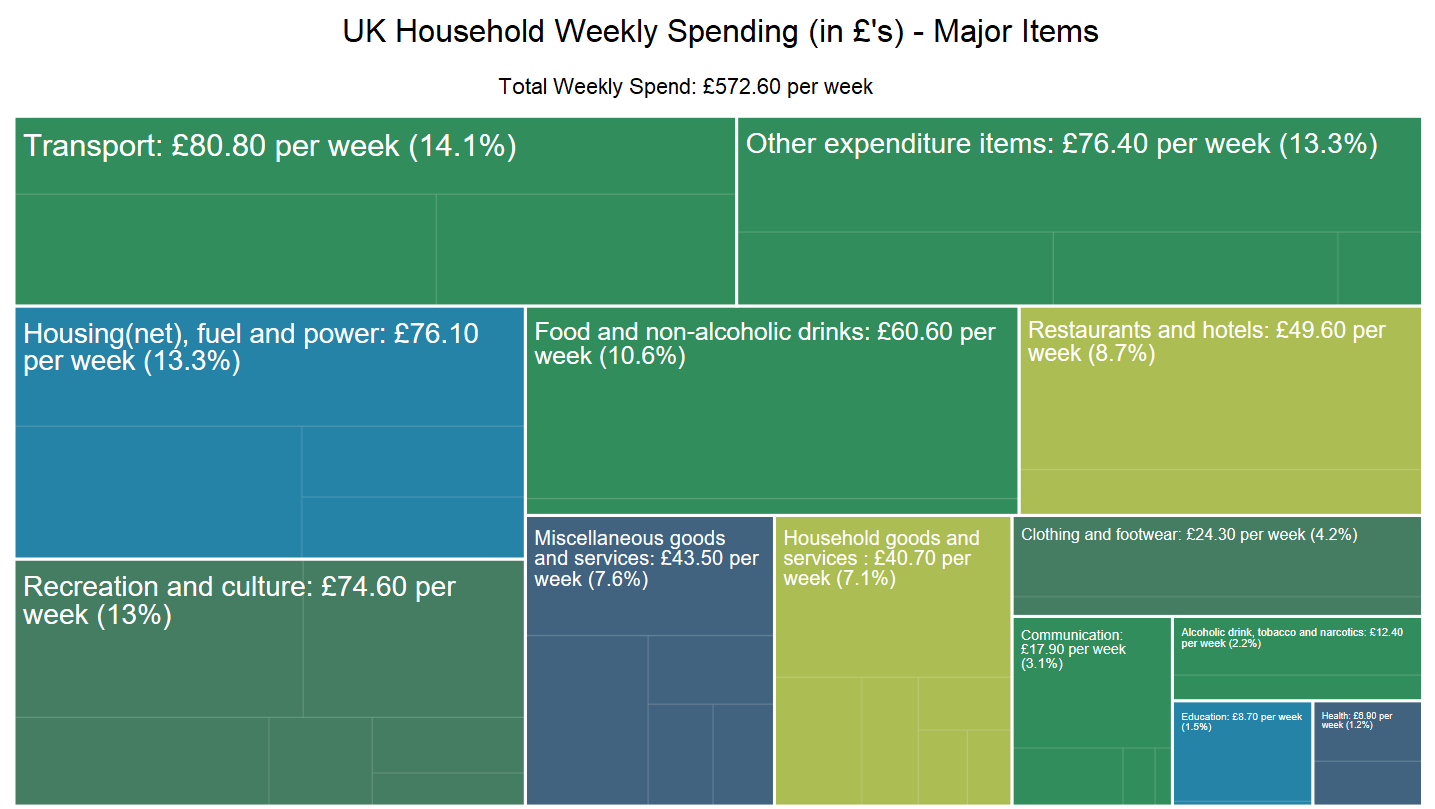
· Transport was the category with the highest average weekly spend of £80.80, equivalent to 14% of households’ average total weekly household expenditure.
· Spending on transport remains the highest, over £10 a week higher in FYE 2018 than the lowest point in 2012.
· Spending on housing, fuel and power showed a general rise to a high in 2013, since then it has been fairly stable.
· Spending on recreation and culture has shown a general increase over time.
· Households’ average weekly spend on alcoholic drinks away from the home was less in the financial year ending 2018 (£8.00) compared with 10 years ago (£10.90), after adjusting for inflation.
Related:
The UK’s net worth is now estimated at £10.2 trillion, an average of £155000 per person
This is how wealthy UK households are
UK households have seen their outgoings surpass their income for the first time in nearly 30 years
The UK economy a decade on from the 2008 recession
Nominal wages in the UK grew fastest in a decade but real wages are still lower than a decade ago