“Geography has made us neighbors. History has made us friends. Economics has made us partners, and necessity has made us allies.” – John F. Kennedy
The Vote
The historic referendum on the 23rd of June 2016 when the British public were asked the question
“Should the United Kingdom remain a member of the European Union or leave the European Union?”
with the options
Remain a member of the European Union
(OR) Leave the European Union
51.9% of voters voted to Leave the European Union
“I’ve been clear that Brexit means Brexit.” – Current United Kingdom Prime Minister Theresa May
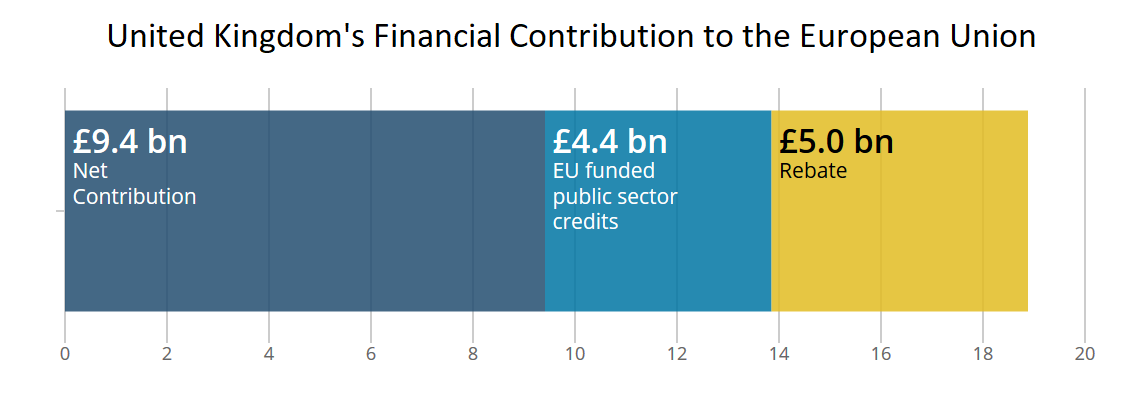
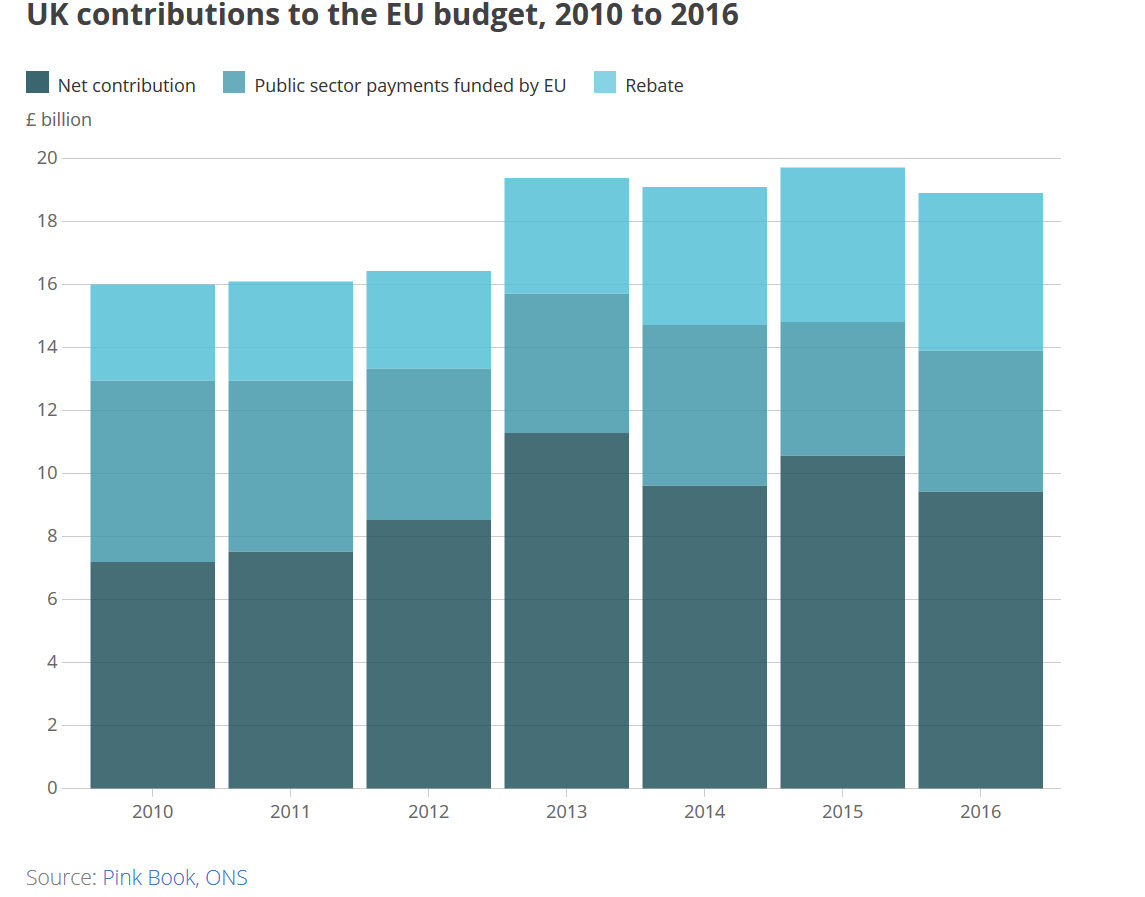
The UK’s real contribution to the EU Budget
The UK contributed a gross amount of £18.8 billion (£362 million a week or 2.3% of all government spending in 2016) to the European Union Budget.
On a net contribution basis, the amount was £9.4 billion (£181 million a week or 1.2% of all government spending in 2016) to the European Union Budget.
The numbers above are official and audited numbers from the UK Government.
British Nationals in the European Union
An estimated 800,000 British Nationals live and work in other European Union member states.
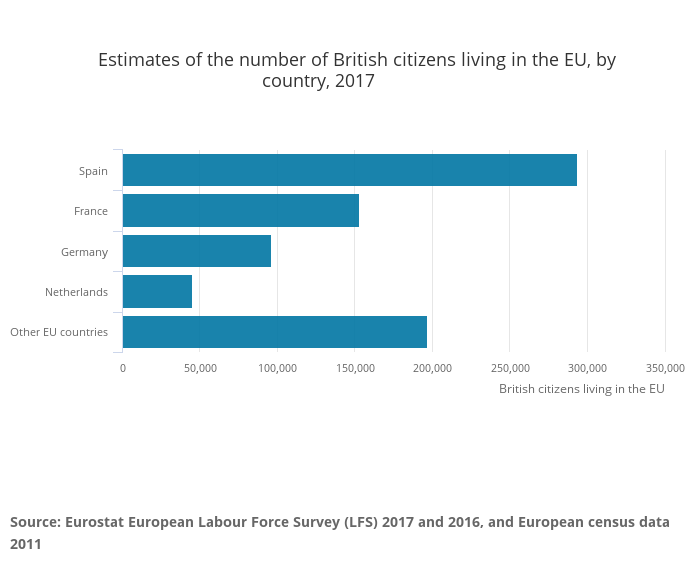
Contrary to popular belief, most British citizens are of working age (15-64) and work in the European Union rather than those who have retired to European Union member states.
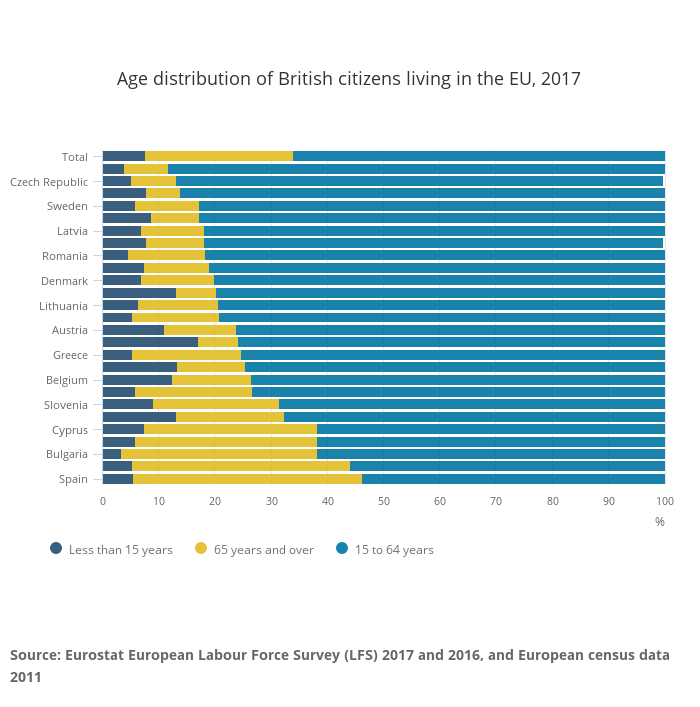
As per Eurostat, British Nationals in other European Union member states earn more than locals which suggests they might be doing higher end jobs.
The economic impact of Brexit: We expect the European Union to continue allowing British Nationals currently (pre-Brexit) in European Union member states to live and work there. As such majority of British Nationals in the European Union aren’t necessarily filling low wage jobs or skill shortage jobs so there shouldn’t be an economic impact of Brexit on countries and organizations in the European Union. The European Union member states would likely offer work visas to those who they want to employ from the United Kingdom post Brexit.
European Union Nationals in the United Kingdom
An estimated 4 million European Union Nationals live and work in the United Kingdom.
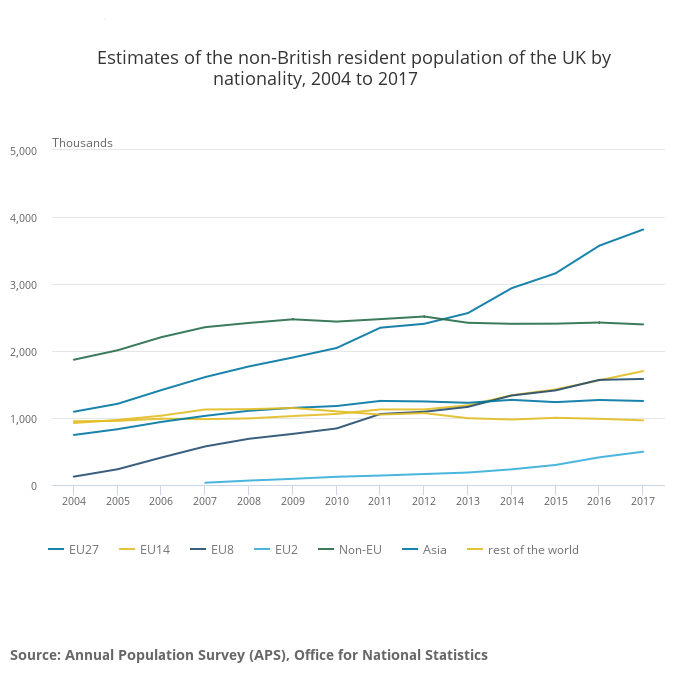
As per Eurostat, European Union citizens in the United Kingdom earn less than locals which suggests they might be doing lower end jobs. United Kingdom government data suggests the same.
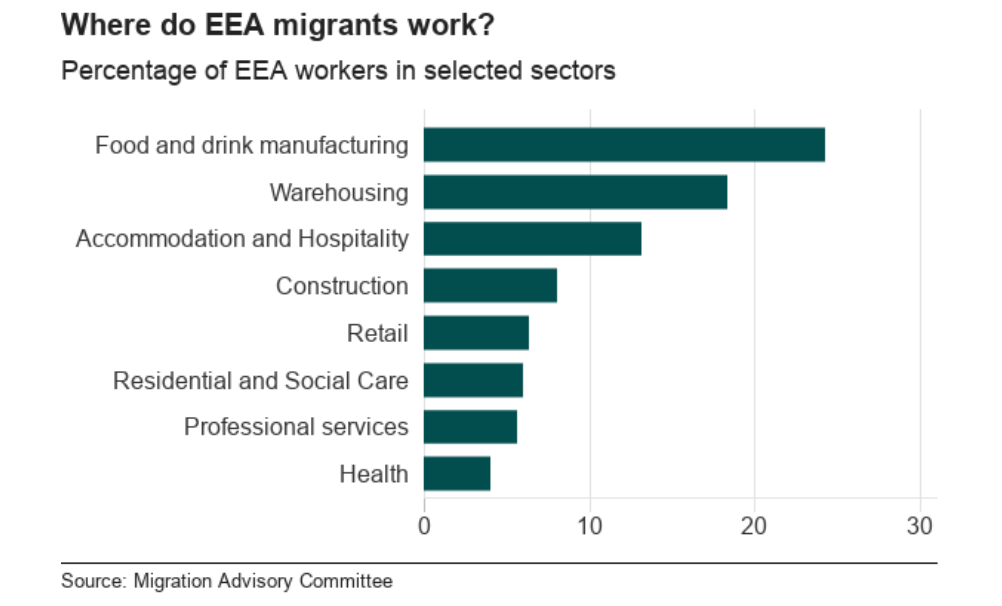
The economic impact of Brexit: We expect the United Kingdom to continue allowing European Union citizens currently (pre-Brexit) in United Kingdom to live and work there. But going forward (post Brexit) there would be restrictions on the minimum wage requirement European Union citizens would require to obtain a visa to work in the United Kingdom. The United Kingdom could have shortage of labour in the farm, social care and hospitality sectors but wages are likely to rise significantly at the lower end of the wage spectrum. The United Kingdom could start spending more money to train people in skill shortage sectors.
Economic Statistics for the European Union – Past, Present and Future
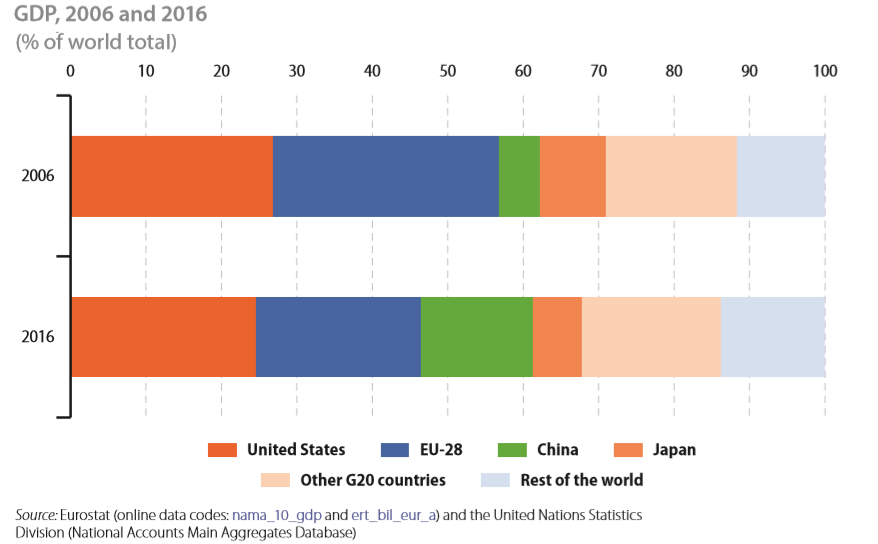
Share of global GDP
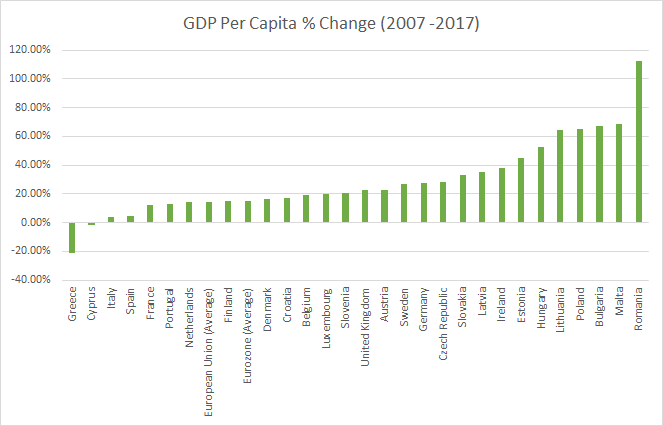
The European Union’s share of global GDP fell from 30% in 2006 to 22% in 2016. Parts of the EU have seen GDP per capita shrink and the overall compounded annual growth rate was just 1.2% between 2007 and 2017. GDP growth adjusted for inflation was negative. (Read More: Parts of the European Union have seen nominal GDP per capita fall between 2007 and 2017)
Share of World’s population
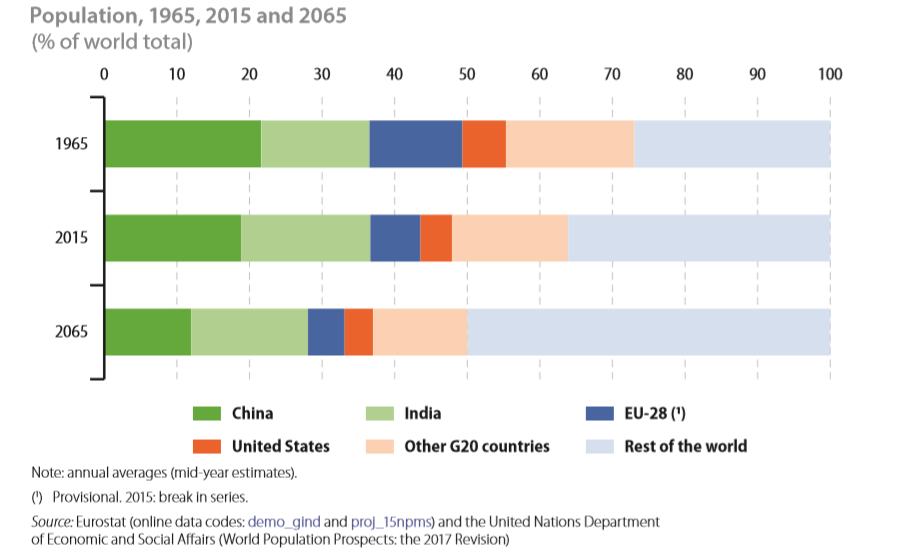
The European Union’s share of the world’s population is projected to fall from 6.9% in 2015 to 5.0% by 2065.
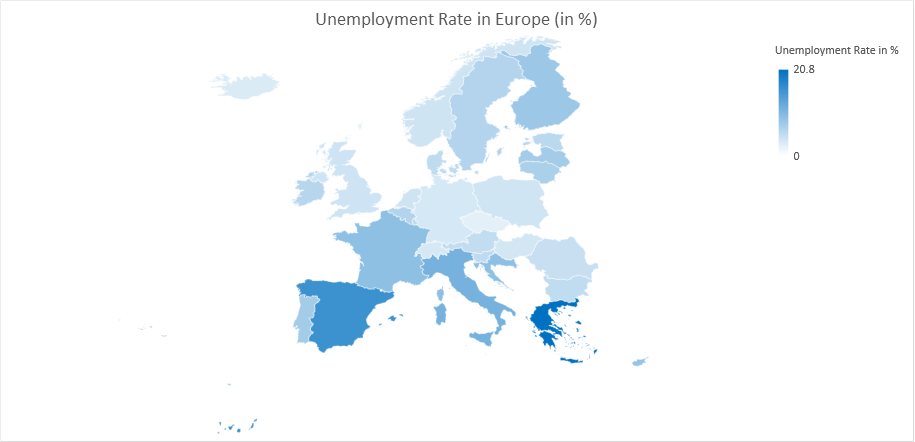
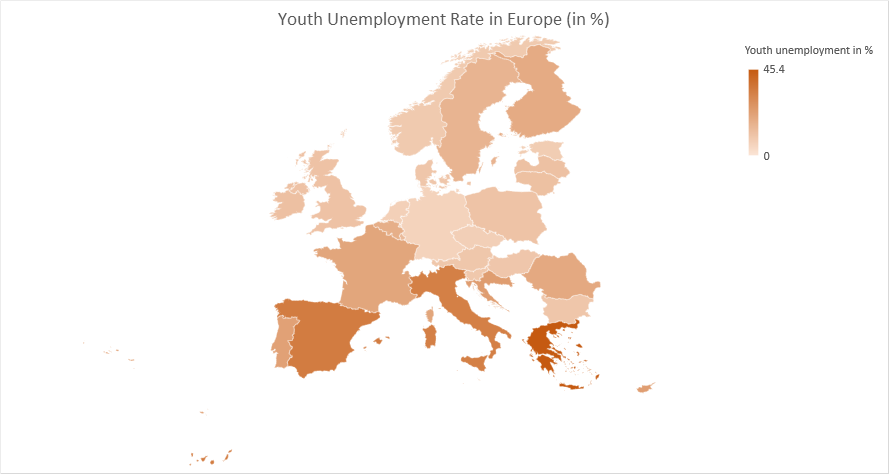
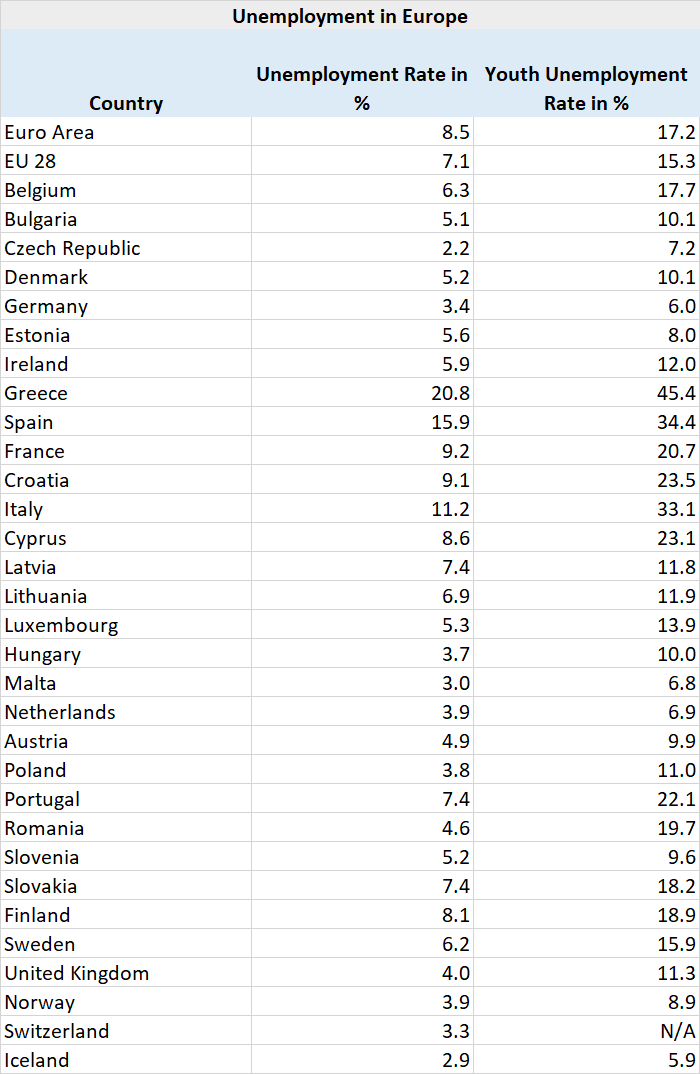
Employment Rate
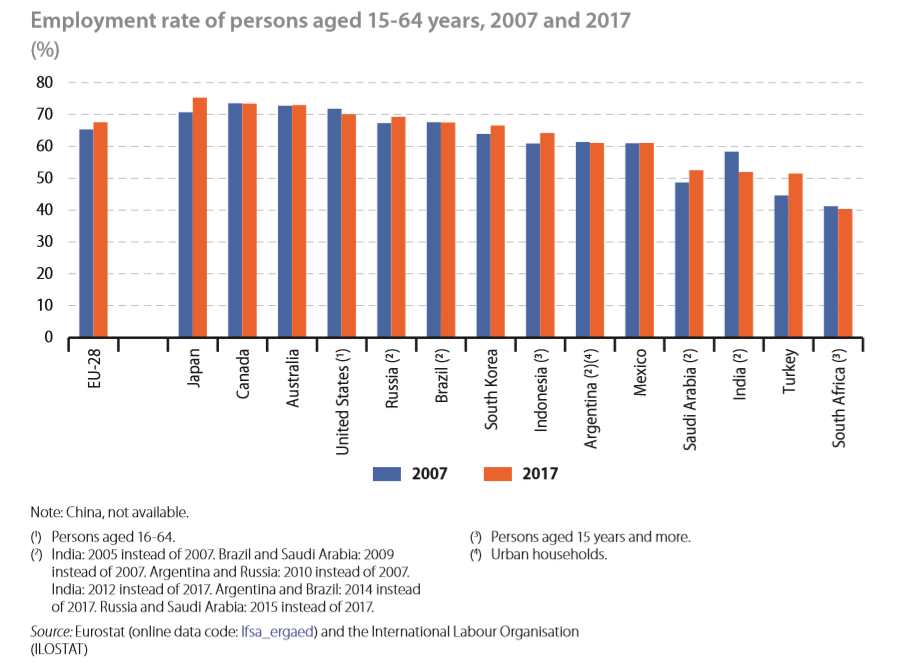
The employment rate, calculated as the share of employed persons in the total population of working age (defined here as persons aged 15-64 years), was 67.6 % in 2017 in the European Union. Between 2007 and 2017 the employment rate for the European Union increased 2.3 percentage points from 65.3%. Youth unemployment remains a big issue though. (Read more: Unemployment in Europe is lowest since 2008 but is still twice that of the United States)
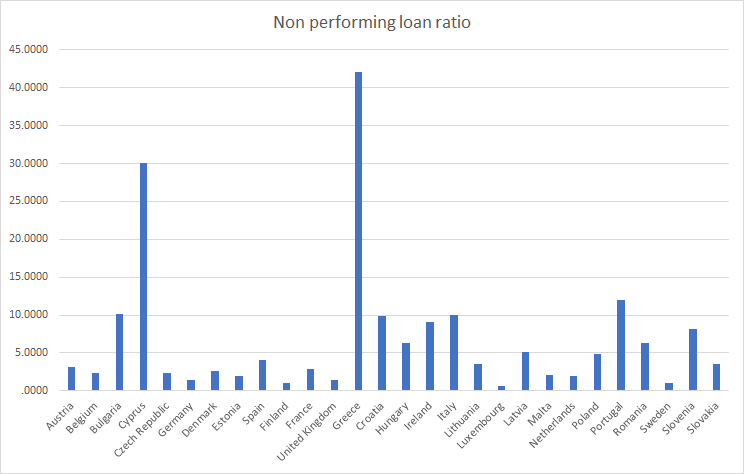
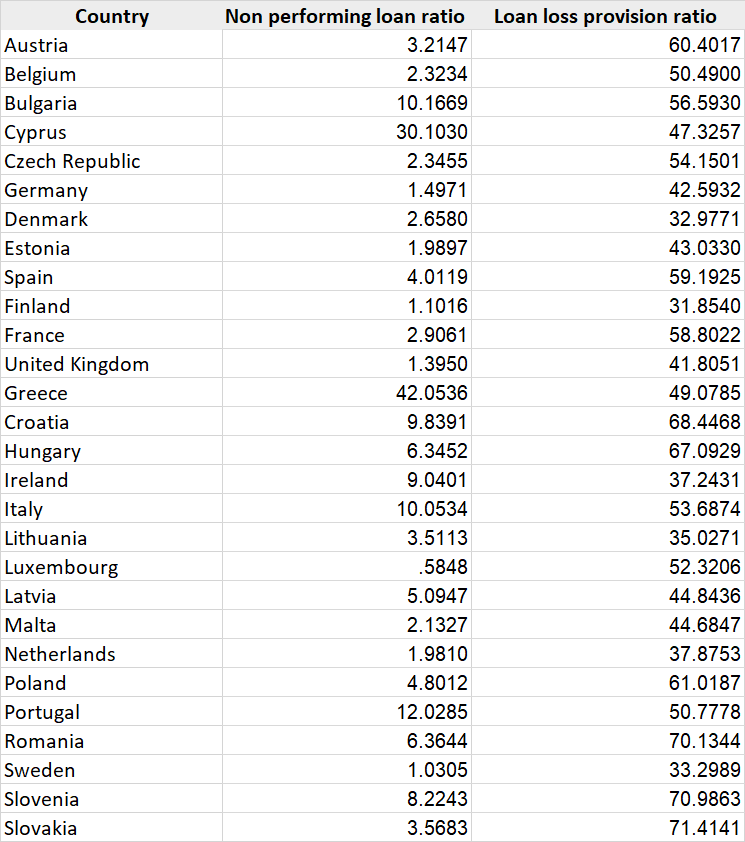
The European Banking Crisis
Banks in Greece, Cyprus, Portugal and Italy have a non-performing loan ratio of over 10% a decade on from the financial crisis and have only provisioned around 50% of the losses. The European Banking Crisis is far from over.
2018 feels just like 2008 for European Banks …
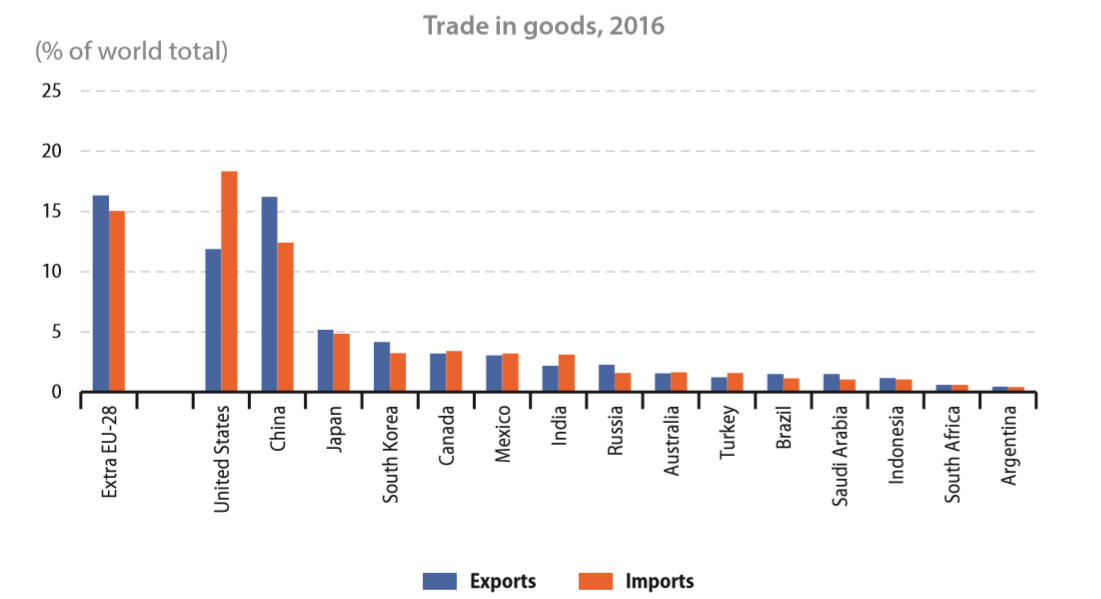
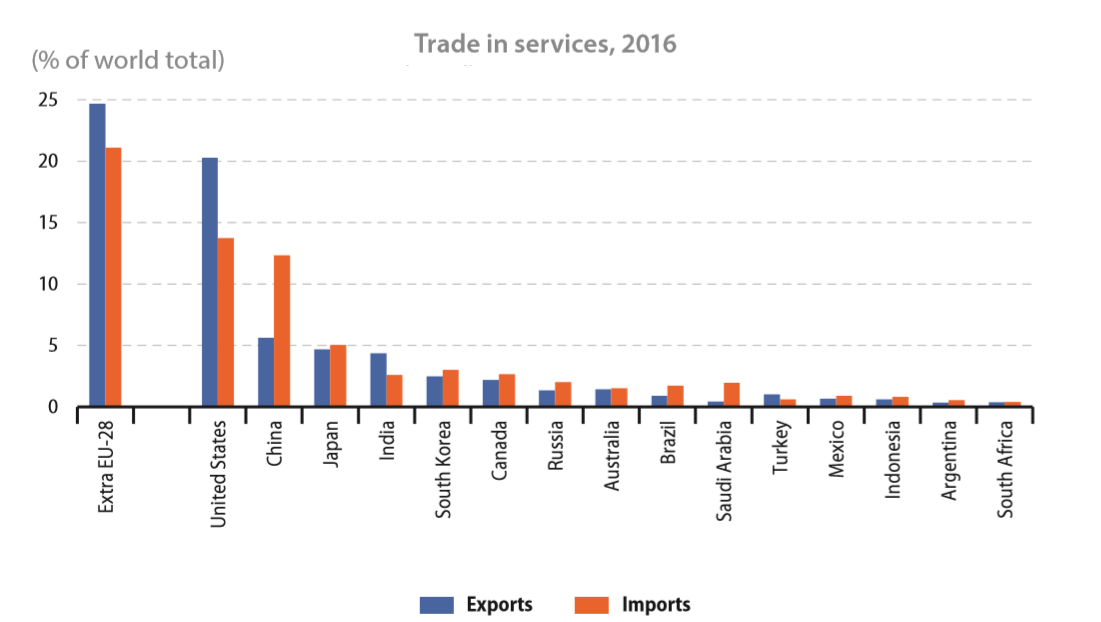
Trade
The European Union (EU28 or EU) accounted for around one sixth of world trade in goods in 2016, with a 16.3% share of exports and a 15.0% share of imports. Turning to services the EU28’s contribution to world trade (mainly due to the United Kingdom which is leaving the European Union) was even greater, totalling 24.7% of exports and 21.1% of imports.
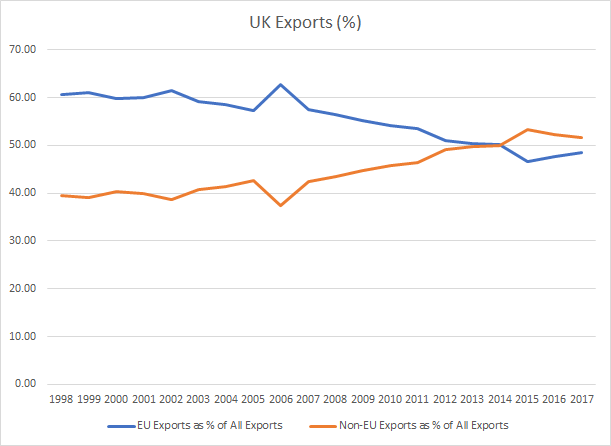
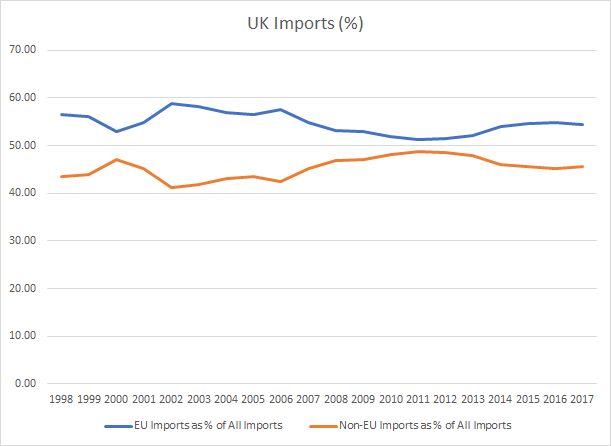
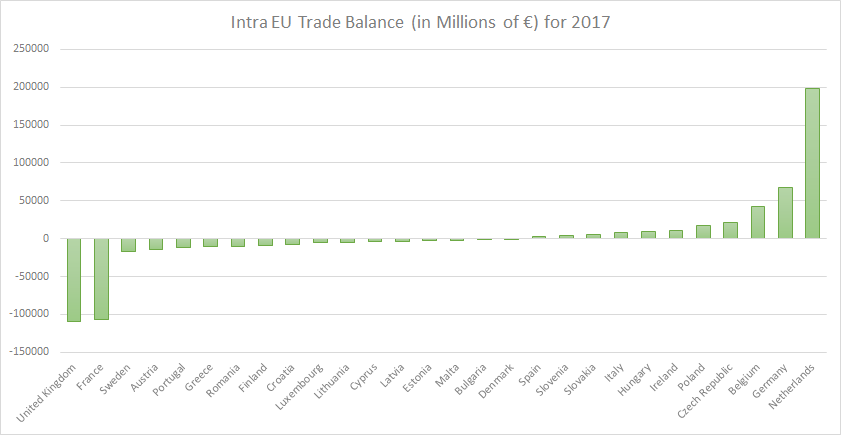
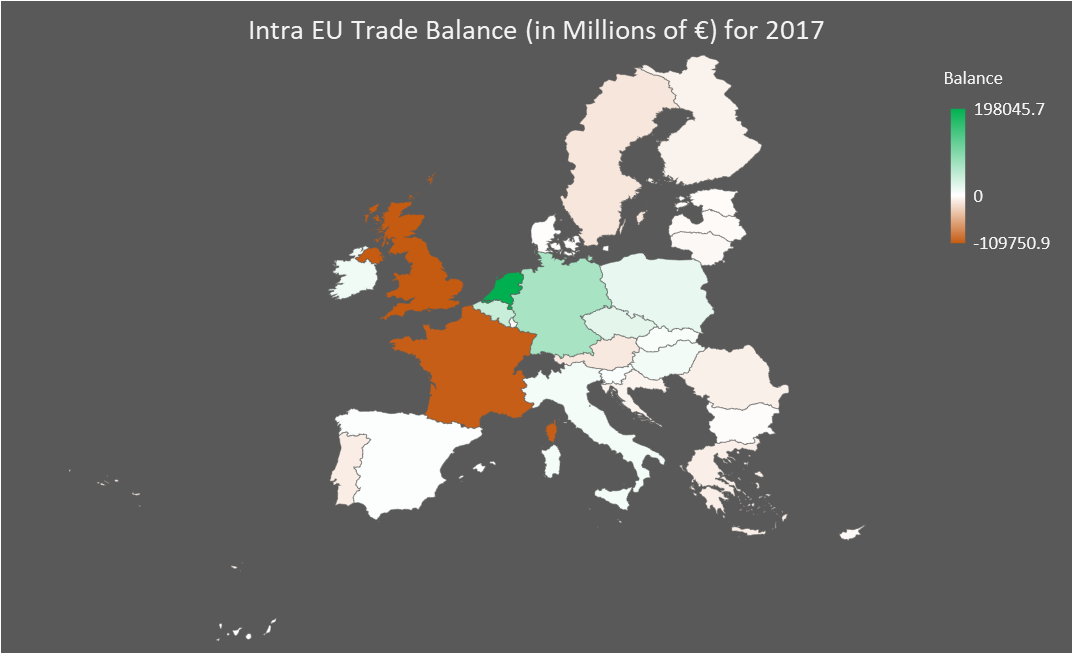
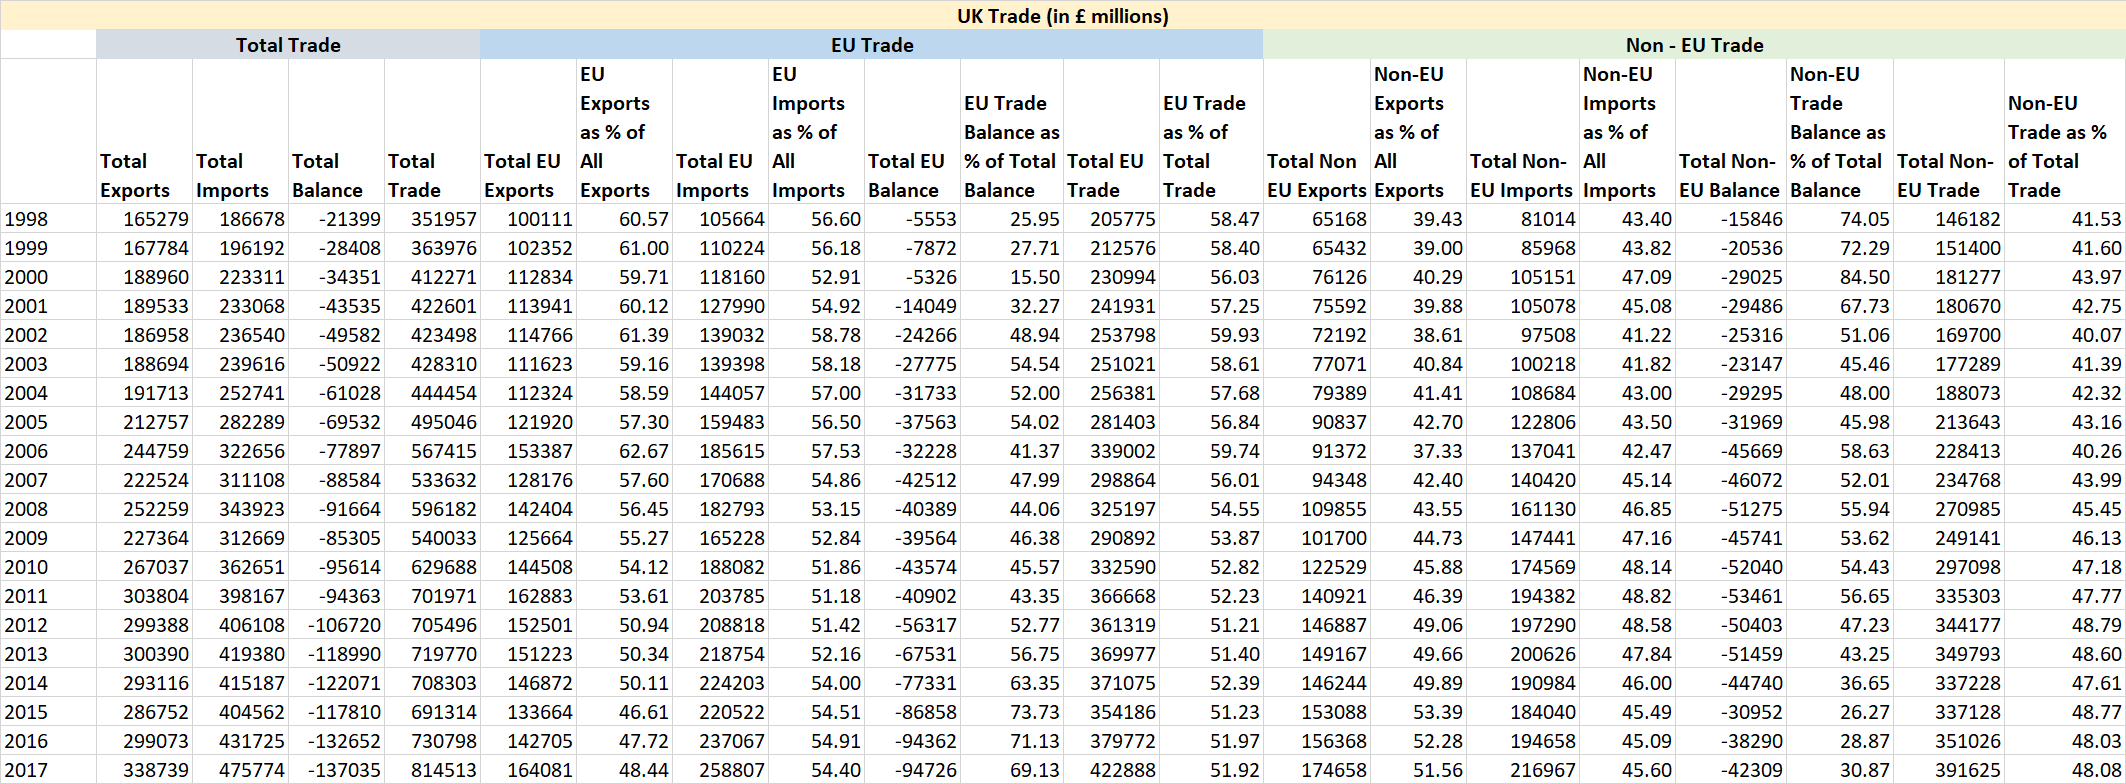
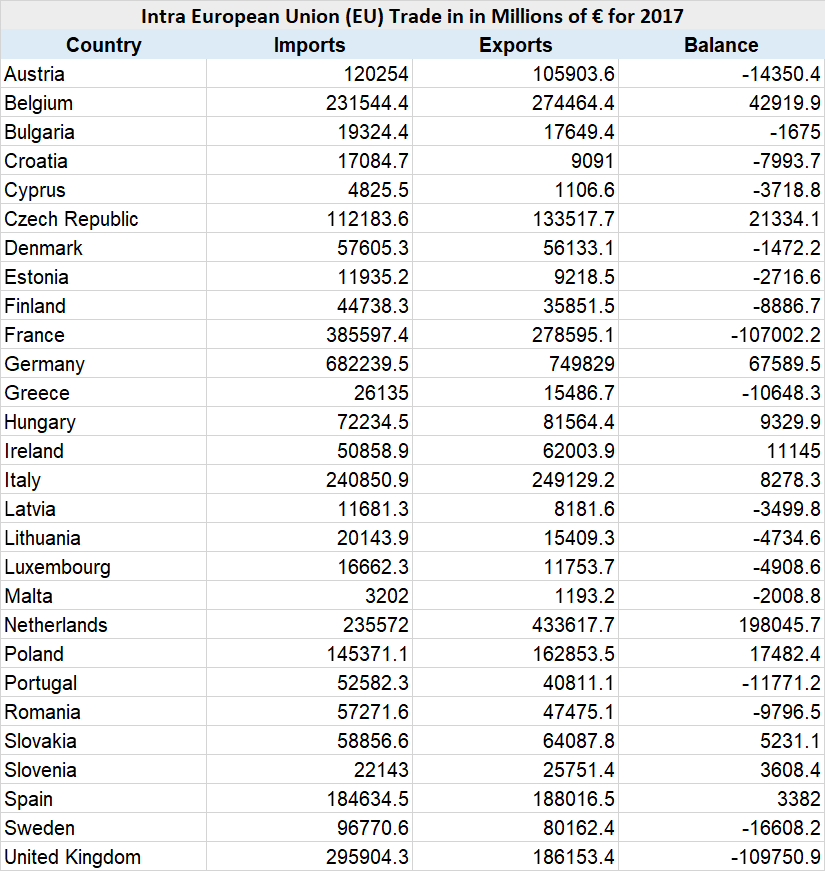
How reliant is the United Kingdom on the European Union for trade? The answer to that is around 52% in 2017 (down from 59% in 1998 and 55% in 2008). 48% of UK exports go to the European Union (EU) but 55% of UK imports are from the European Union. Exports to the EU have been decreasing but imports have been increasing. 69% of the trade deficit of the United Kingdom can be attributed to trade with the European Union. The United Kingdom had the largest trade deficit of €110 billion in intra-EU trade in 2017.
Exports to EU countries have been decreasing as exports to non-EU countries have been increasing
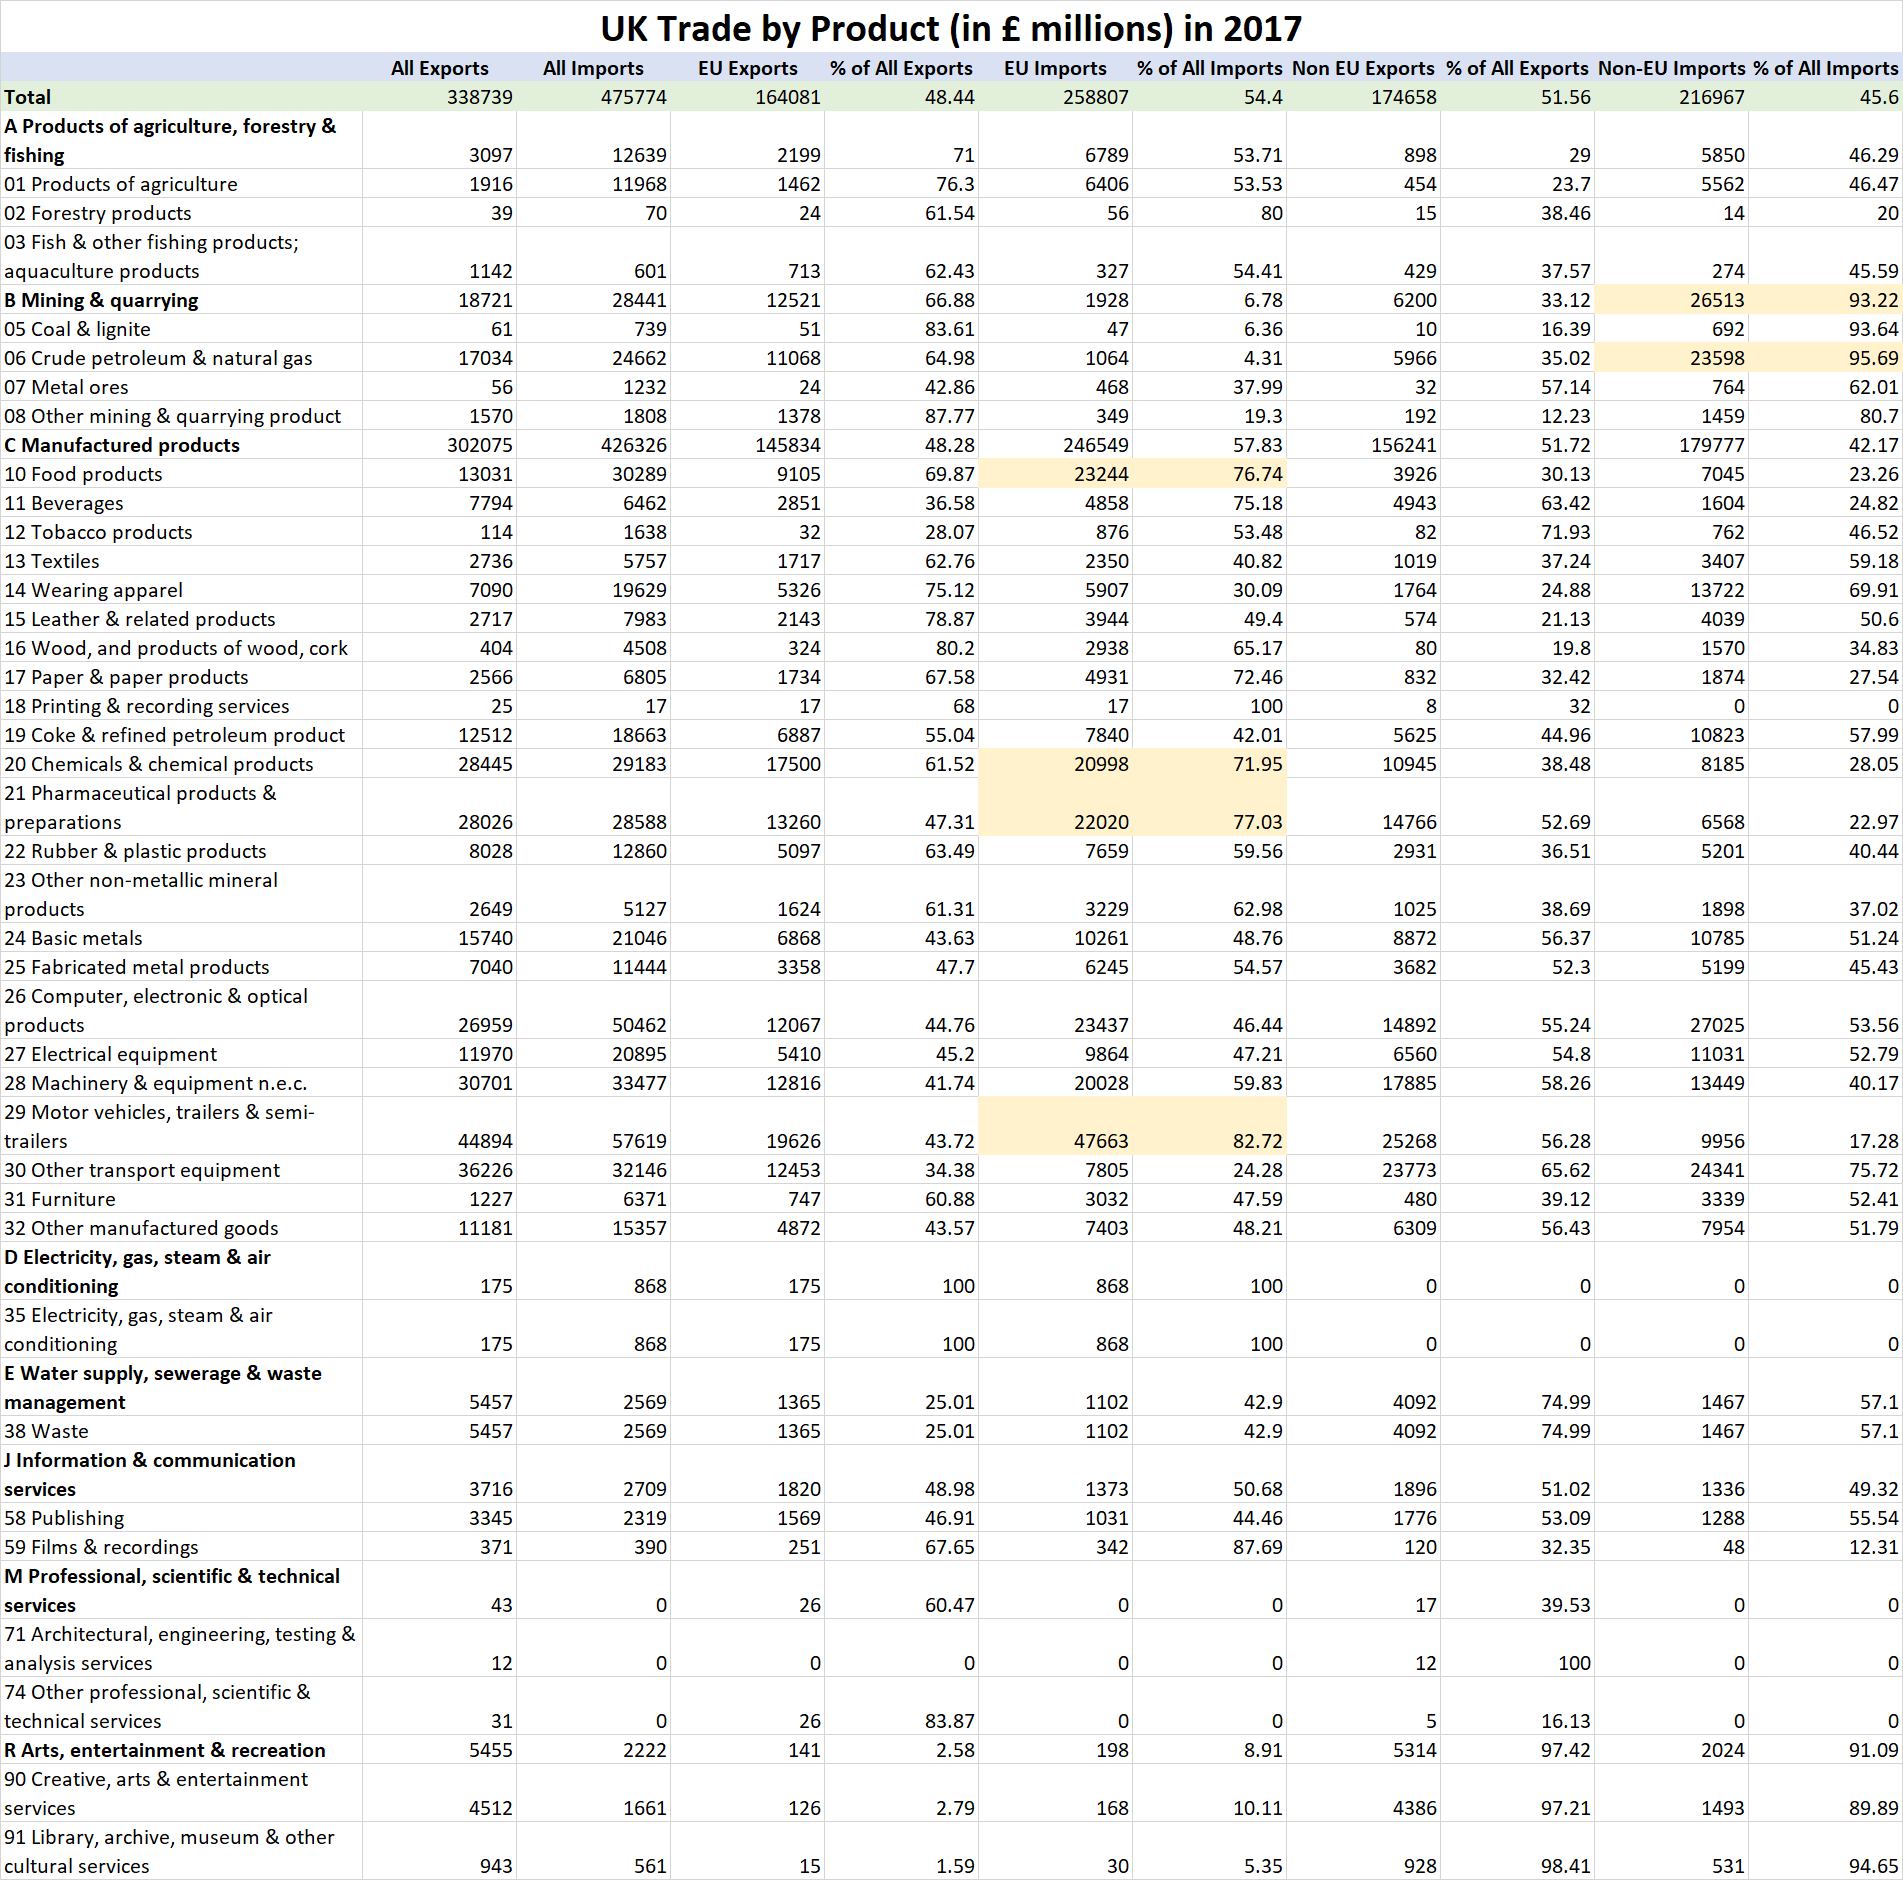
- £25 billion (or 57% of all exports in the category) of all cars manufactured in the UK in 2017 were exported to non-EU countries.
- £24 billion (or 66% of all exports in the category) of other transport equipment were exported to non-EU countries in 2017.
- £18 billion (or 58% of all exports in the category) of all machinery exports were exported to non-EU countries in 2017.
Imports from the EU have been increasing mainly down to tariff’s on non-EU imports
- £48 billion (or 83% of all imports in the category) of Motor Vehicles were imported from the EU in 2017.
- £22 billion (or 77% of all imports in the category) of Pharmaceutical products were imported from the EU in 2017.
- £21 billion (or 72% of all imports in the category) of Chemicals were imported from the EU in 2017.
- £23 billion (or 77% of all imports in the category) of Processed foods were imported from the EU in 2017.
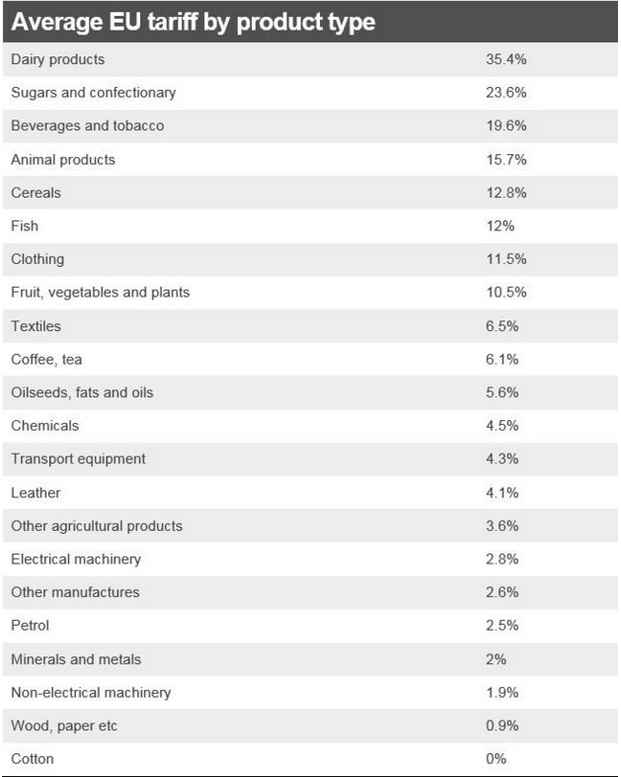
Motor Vehicles, Pharmaceutical products, Chemicals and Processed foods are all categories where the EU has high import tariffs.
Trade with non-EU countries have been increasing at a quicker pace than trade with the EU
48% of UK exports went the European Union in 2017 but 55% of UK imports were from the European Union in 2017. Like we covered previously, Exports to the EU have been decreasing but imports have been increasing.
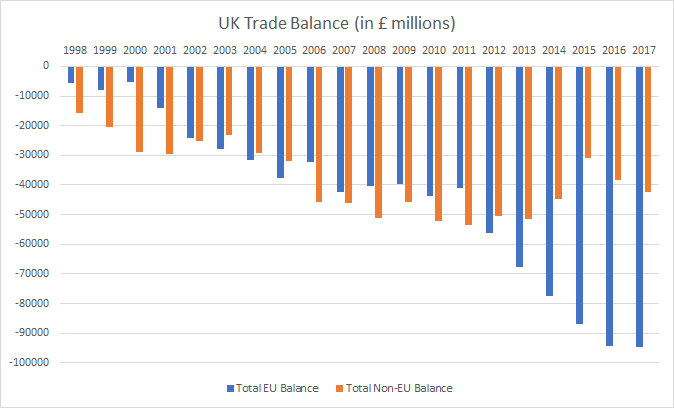
69% of the trade deficit of the United Kingdom can be attributed to trade with the European Union
The United Kingdom had the largest deficit in intra-EU trade in 2017,
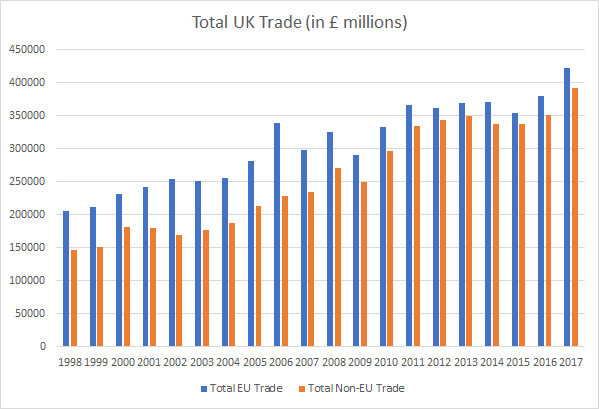
Here is the dataset for UK trade for the past two decades split by EU and non-EU trade,
Here is the dataset for UK trade by product in 2017,
Here is the dataset for Intra EU Trade in 2017,
The economic impact of Brexit: The United Kingdom and the European Union are heavily dependent on each other for trade. 48% of UK exports go to the European Union (EU) but 55% of UK imports are from the European Union. Exports to the EU have been decreasing but imports have been increasing. 69% of the trade deficit of the United Kingdom can be attributed to trade with the European Union. On both sides, jobs are at stake. The United Kingdom had the largest trade deficit of €110 billion in intra-EU trade in 2017. A border that isn’t frictionless for trade would be detrimental for both sides and it would cost jobs on both sides but more jobs for the European Union than the United Kingdom. A trade border would inevitably increase time and costs for trade.
The United Kingdom could pivot to other parts of the world for trade. Currently, the United Kingdom is heavily dependent on European Union partners for imports in the categories of Motor Vehicles, Pharmaceutical products, Chemicals and Processed foods only because the EU has high tariffs and strict regulations for imports for these product categories.
If the United Kingdom replicates European Union tariffs, it would earn £9 billion in tariffs on imports and pay about £4.2 billion in tariffs on exports to the European Union, which would imply £4.8 billion in additional government revenue for the United Kingdom but that would increase costs for consumers.
Here are EU tariffs on a selection of product categories,
What kind of a deal?
“You can check out any time you like, but you can never leave!” from the Eagles song ‘Hotel California’
Firstly, almost all European Union deals have been signed at the very last minute. Will this time be any different?
European Economic Area deal: This would mean ECJ jurisdiction, free movement, substantial financial contributions to the EU budget and no Regulatory autonomy for the United Kingdom. Not likely to happen.
Swiss type deal: This would mean free movement, substantial financial contributions to the EU budget and no Regulatory autonomy for the United Kingdom. Not likely to happen.
Ukraine type deal: This would mean ECJ jurisdiction and no Regulatory autonomy for the United Kingdom. Not likely to happen.
Turkey type deal: This would mean that the EU dictates trade policy. Not likely to happen.
Chequers deal proposed by the UK: Common rulebook for all goods including agricultural goods with the UK committing in a treaty to ongoing harmonisation with EU rules when necessary to provide for frictionless trade at ports and the border with Ireland. The UK Parliament would have the ability to choose not to incorporate future rules. A common rulebook on state aid would be agreed, preventing either side from subsidising their own industries. The UK will commit to maintaining high environmental, climate change, social, employment and consumer protection standards. The UK would apply EU’s tariffs and trade policy on goods intended for the bloc but would control its own tariffs and trade for the domestic market. Red line for the EU on the integrity of the single market. Not likely to happen.
Canada type deal: Most likely as it does not cross the red lines of either the UK or the EU.
Other things
Will standards fall in the United Kingdom after its departure from the European Union? Not really, the European Union does have high standards in several areas but also has strange standards in other areas. For instance, vanilla ice cream doesn’t need to contain either vanilla or cream to be officially considered as “Vanilla ice cream”. Why? So that it remains affordable to the masses.
The EU’s Common Fisheries Policy (CFP) has denied the UK control of its own waters, depleted its fish stocks and caused severe ecological degradation. CFP rules have also disproportionately subsidised non-UK EU fishermen.
The EU claims it does not allow state subsidy, but it is everywhere. Take ports for instance, Dutch ports are exempt from corporation tax; Antwerp, Bremerhaven, and Hamburg’s infrastructure costs are covered by the state; French and Belgian ports receive tax breaks. All these are contrary to EU state aid rules and create a competitive advantage over ports in other member states.
Total cost of Brexit
Over the short term, both the European Union and the United Kingdom stand to lose significant jobs and money if no deal is agreed. The best possible deal for the United Kingdom would be to leave with a Canada type trade deal which would save it around £9.5 billion in net EU budget contributions, prevent it from ECJ (European Court of Justice) jurisdiction and allow it to sign trade deals with the world. It would inevitably bring a period of rebalancing the economy. There would be costs of around £1 billion a year in developing and maintaining new regulations independent of the EU. The worst possible deal for the UK would be to be tied to ECJ jurisdiction, free movement, substantial financial contributions to the EU budget and no Regulatory autonomy.
If the United Kingdom replicates European Union tariffs and adopts WTO rules, it would earn £9 billion in tariffs on imports and pay about £4.2 billion in tariffs on exports to the European Union, which would imply £4.8 billion in additional government revenue for the United Kingdom but that would increase costs for consumers.
The best deal for both the European Union and the United Kingdom would be to have a sensible trade deal and maintain a close relationship with each other.
As any couple on relationship crossroads will agree – this time it is different.
Everything Brexit:
The story of UK trade with the European Union for the last two decades
UK Trade Statistics for trade by each country
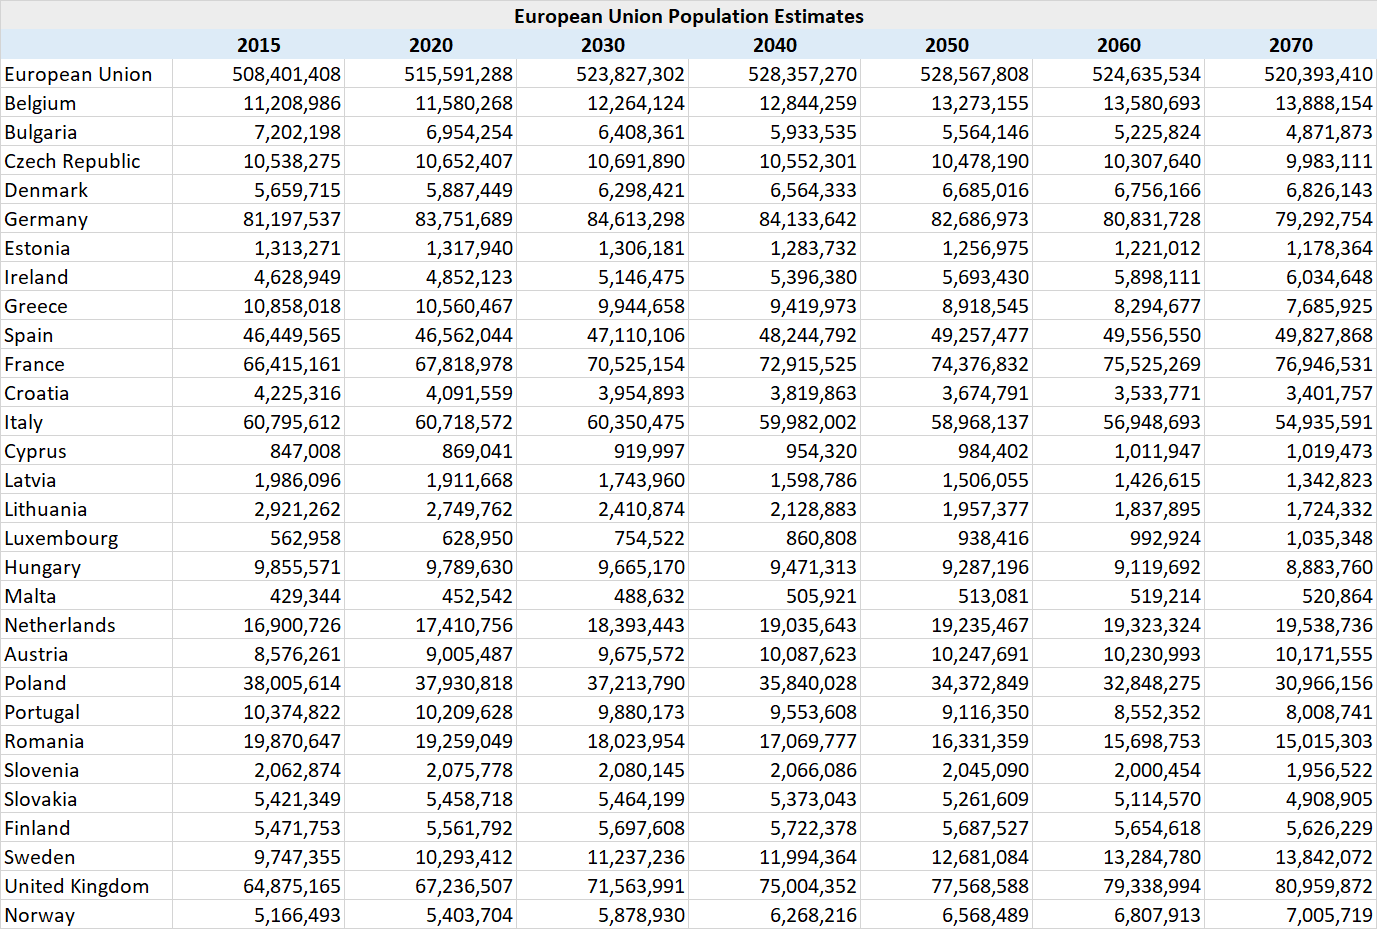
Past, present, future – some demographic and economic statistics for the European Union
Europe’s lost economic decade in charts
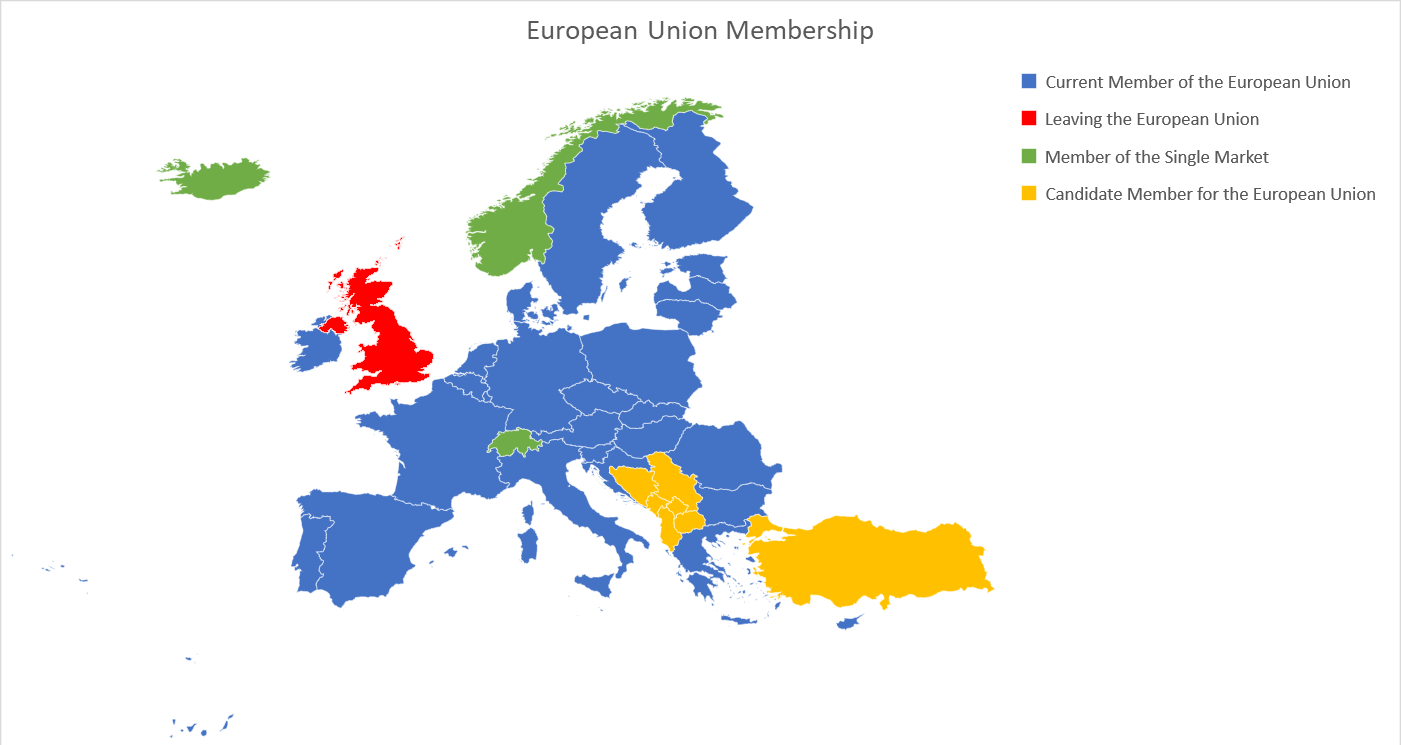
Here’s how the demographic and economic statistics look for candidate members of the European Union
The European Union (EU28) currently includes Belgium, Bulgaria, the Czech Republic, Denmark, Germany, Estonia, Ireland, Greece, Spain, France, Croatia, Italy, Cyprus, Latvia, Lithuania, Luxembourg, Hungary, Malta, the Netherlands, Austria, Poland, Portugal, Romania, Slovenia, Slovakia, Finland, Sweden and the United Kingdom.
Great article! Objective and based on data… showing pros and cons of each possible scenario. Something very rare in today’s poor quality and biased media.
Thank you, appreciate your feedback.
Thank you for this very useful compilation. I lost interest in the Brexit debate when it became apparent that we were considering ditching NI to get Brexit. I’m all for fiddling around to get a deal that’ll keep the EU and the Remainers more or less happy but not at the price of that.
However, when it was a live issue for me the following considerations seemed important –
1. Target 2 balances could complicate the EU financial stats depending on how you view those balances.
2. You’d cross swords with Dr North of “eureferendum” on the summary of EEA benefits and obligations. Dr North confirms we could use EEA/EFTA as a way of squeezing past the exit barriers and it would be worth examining that argument.
3. Population figures are different if you include naturalised EU citizens not originating from their respective EU countries.
4. Unemployment figures are generally understated but you know that already, no doubt.
5. A glaring omission is that you have neglected to include an increasingly urgent reason for leaving the EU: get out before it collapses with us inside. But perhaps you thought that was too obvious to warrant inclusion.