We will be publishing a number of statistics for the United Kingdom (and the European Union) over the next few days in the run up to a major piece we will be publishing on the real economics of Brexit. In the meanwhile, here are trade statistics for trade by each product for the United Kingdom for 2017 (the latest full year of data available) sourced from the Office for National Statistics.
Here are some summary stats (for 2017),
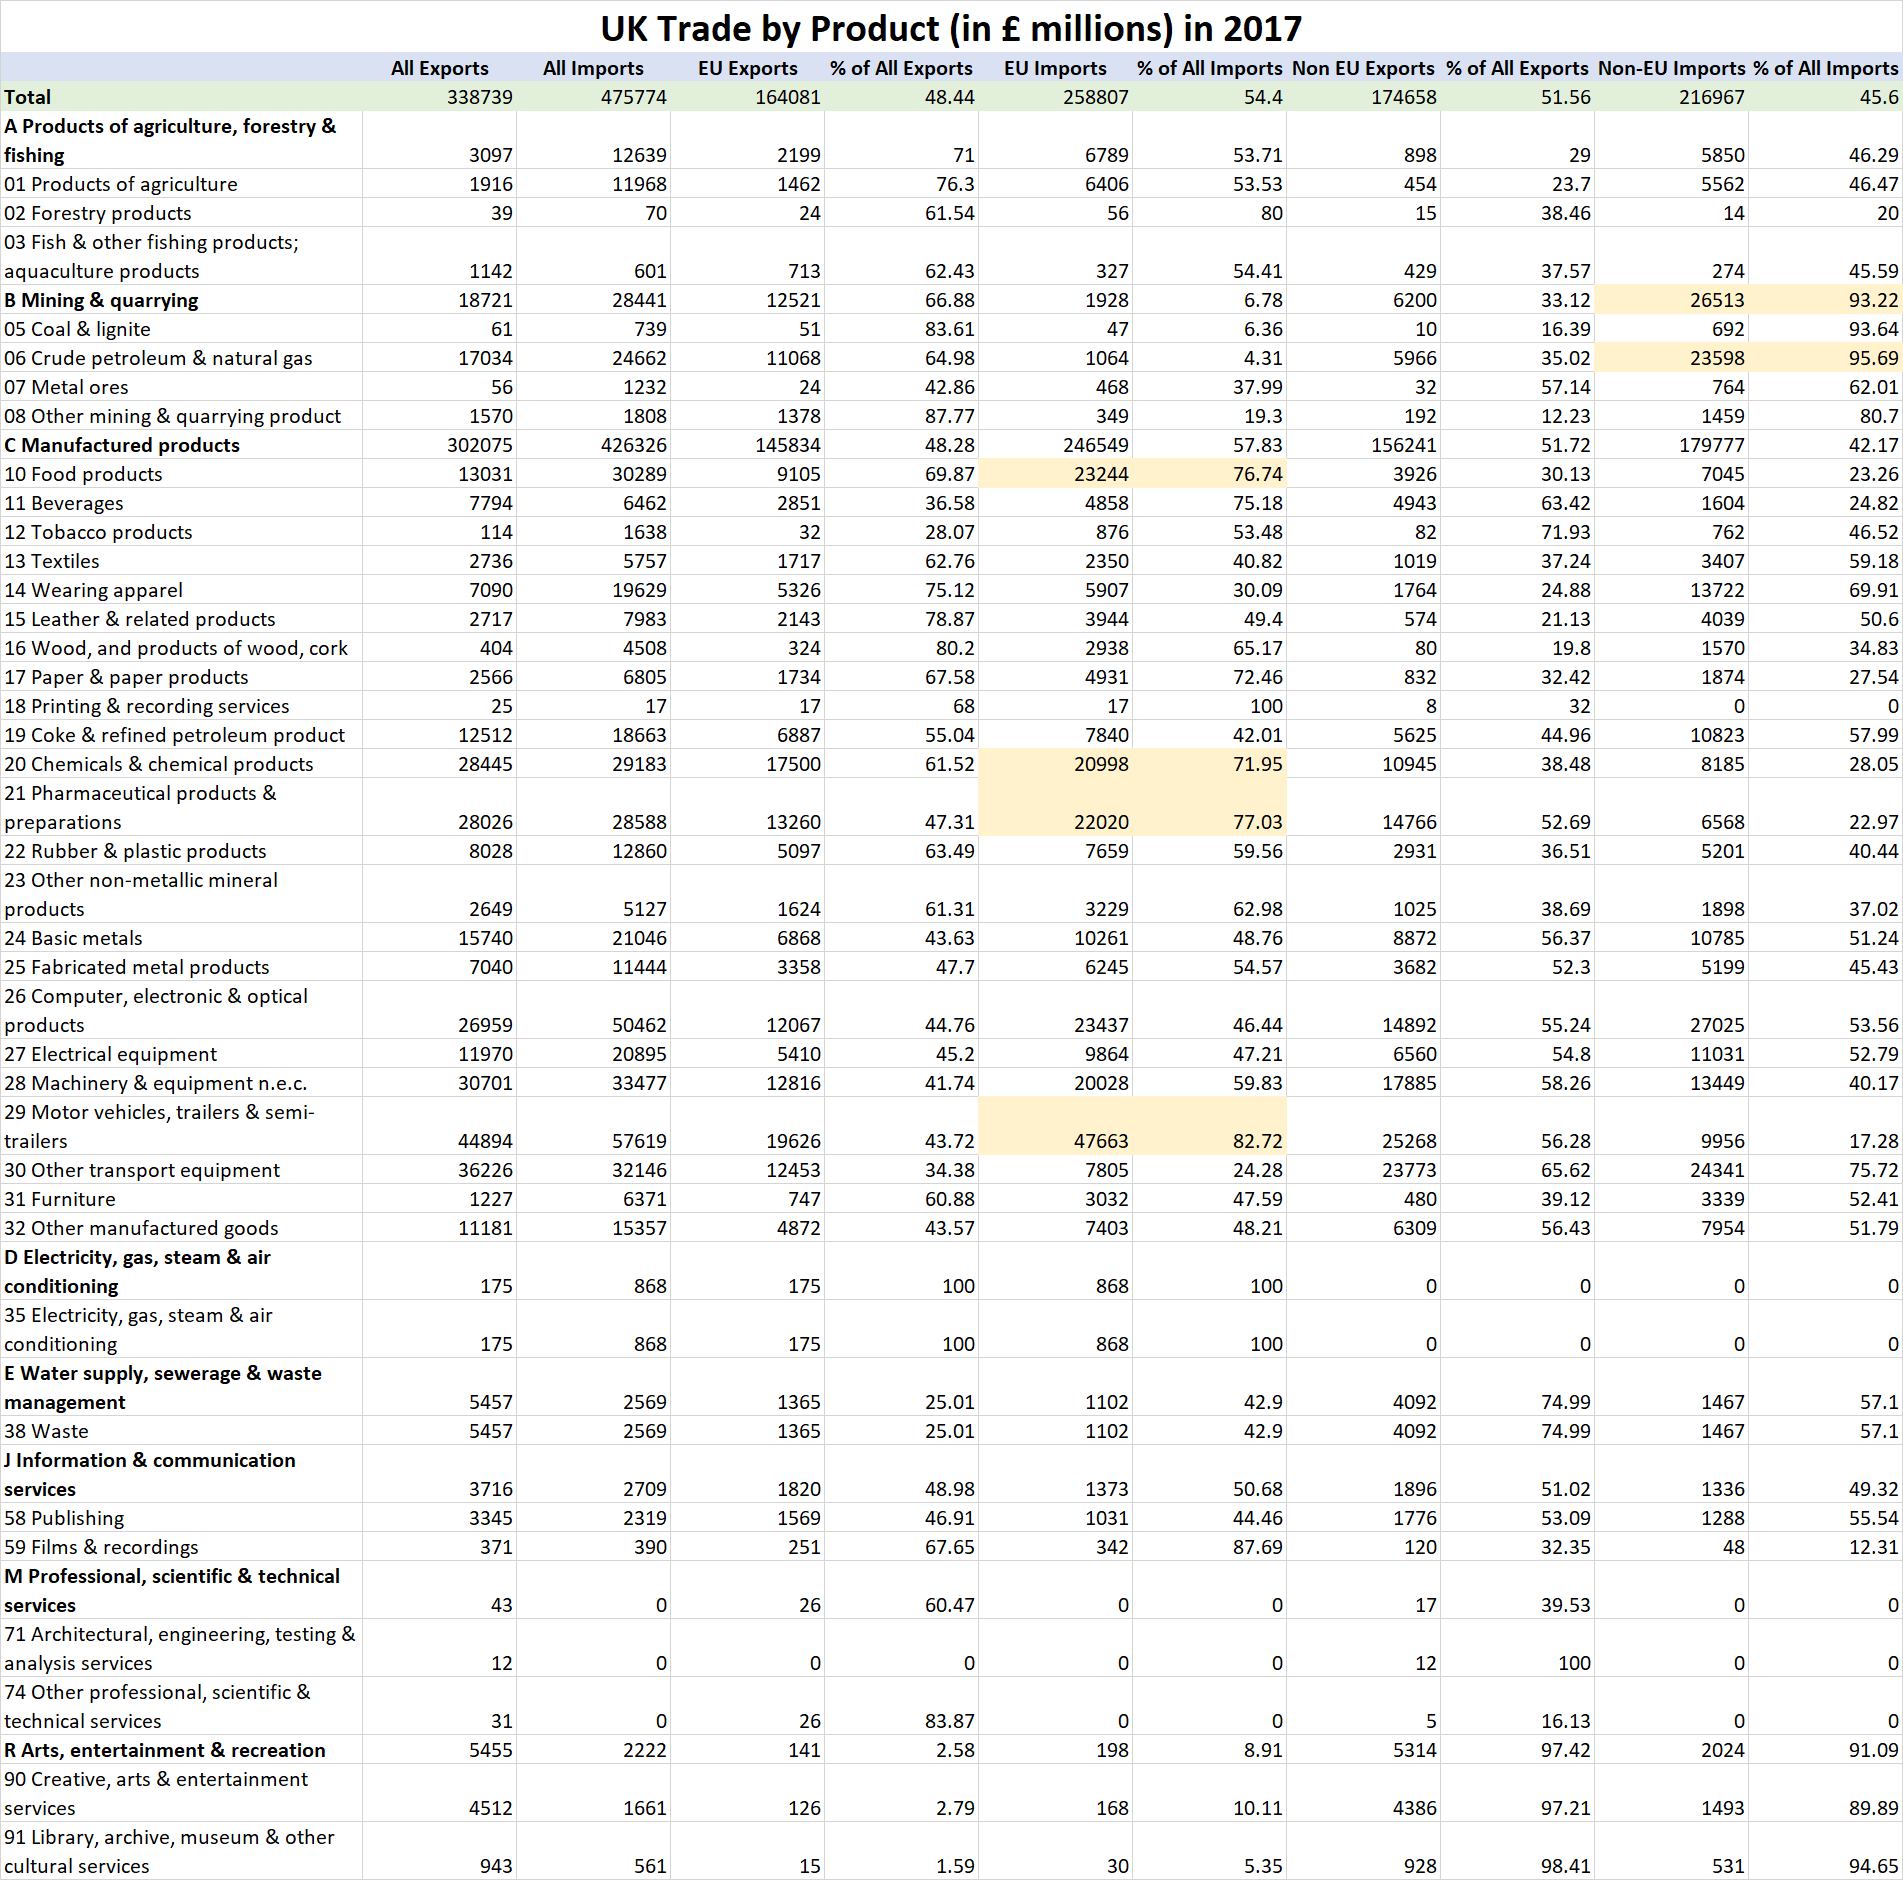
Total UK Trade: £815 billion
Total Exports: £339 billion
Total Imports: £476 billion
Total EU Exports: £164 billion (48.44% of total)
Total EU Imports: £259 billion (54.40% of total)
Total Non-EU Exports: £174 billion (51.56% of total)
Total Non-EU Imports: £217 billion (45.60% of total)
Here’s an interactive tool for trade by country (this won’t work if you have a browser or browser add-on that blocks JavaScript),
And here’s the entire dataset for trade by product (with EU and non-EU split), important items are highlighted in gold,
The European Union (EU28) currently includes Belgium, Bulgaria, the Czech Republic, Denmark, Germany, Estonia, Ireland, Greece, Spain, France, Croatia, Italy, Cyprus, Latvia, Lithuania, Luxembourg, Hungary, Malta, the Netherlands, Austria, Poland, Portugal, Romania, Slovenia, Slovakia, Finland, Sweden and the United Kingdom.
Related:
UK Trade Statistics for trade by each country
Average import tariffs or custom duties per country
All you wanted to know about US trade in 2017 and why China matters so much
14 very interesting things about U.S. trade and trade tariffs
The U.S. only charged 1.65% in import tariffs in 2017
Do nations with balance of payments or trade surpluses really outperform those with deficits?