Has Gold, U.S. Equities or U.S. Property performed the best? We compare the performance of each and the results are surprising.
We have considered performance of the Wilshire US Real Estate Investment Trust Index (Property), Wilshire 5000 Total Market Index (Equities), S&P CoreLogic Case-Shiller U.S. National Home Price Index (Property) and Gold.
Wilshire US Real Estate Investment Trust Index
The Wilshire US Real Estate Investment Trust Index (Wilshire US REIT) measures U.S. publicly-traded real estate investment trusts and is a subset of the Wilshire US Real Estate Securities Index (Wilshire US RESI). Designed to offer a market-based index that is more reflective of real estate held by pension funds, these indexes are unencumbered by the limitations of other appraisal-based indexes. They can serve as proxies for direct real estate investing by excluding securities whose value is not always tied to the value of the underlying real estate. Exclusions include: mortgage REITs, net-lease REITs, real estate finance companies, mortgage brokers and bankers, commercial and residential real estate brokers, home builders, large landowners and sub-dividers of unimproved land, hybrid REITs and timber REITs. The rationale for the exclusions listed is that factors other than real estate supply and demand, such as interest rates, influence the market value of these companies.
Wilshire 5000 Total Market Index
The Wilshire 5000 Total Market Index (Wilshire 5000) is the original U.S. total market index and first index from Wilshire Associates. Created in 1974 and using then-new technologies which made it possible to collect stock prices and calculate returns for a volume of issues never before brought together, the Wilshire 5000 is widely accepted as the definitive benchmark for the total U.S. equity market.
S&P CoreLogic Case-Shiller U.S. National Home Price Index
The S&P CoreLogic Case-Shiller U.S. National Home Price Index is the leading measures of U.S. residential real estate prices, tracking changes in the value of residential real estate nationally.
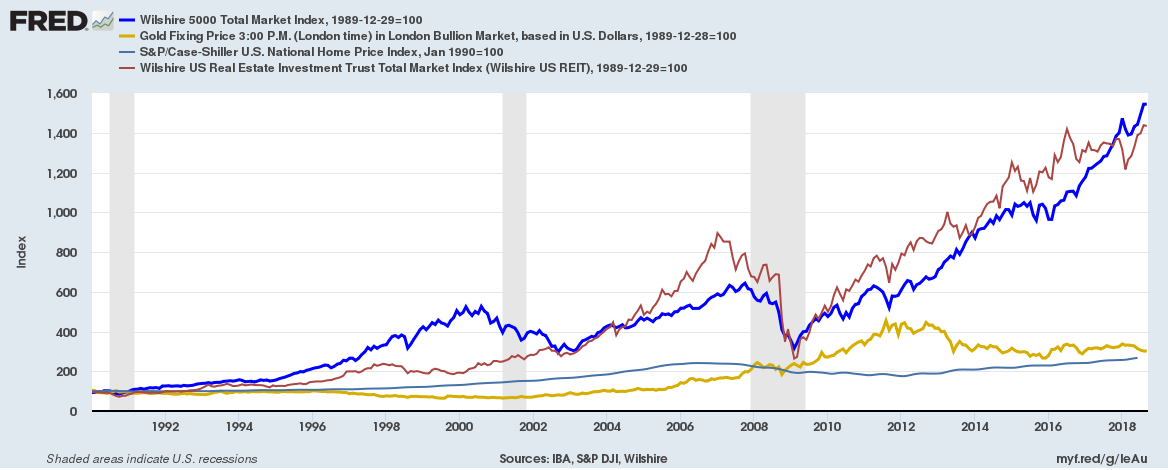
If you had invested $100 on January 1st 1990, you would have
Wilshire 5000 Total Market Index: $1543
Wilshire US Real Estate Investment Trust Index: $1438
Case-Shiller U.S. National Home Price Index: $265
Gold: $301
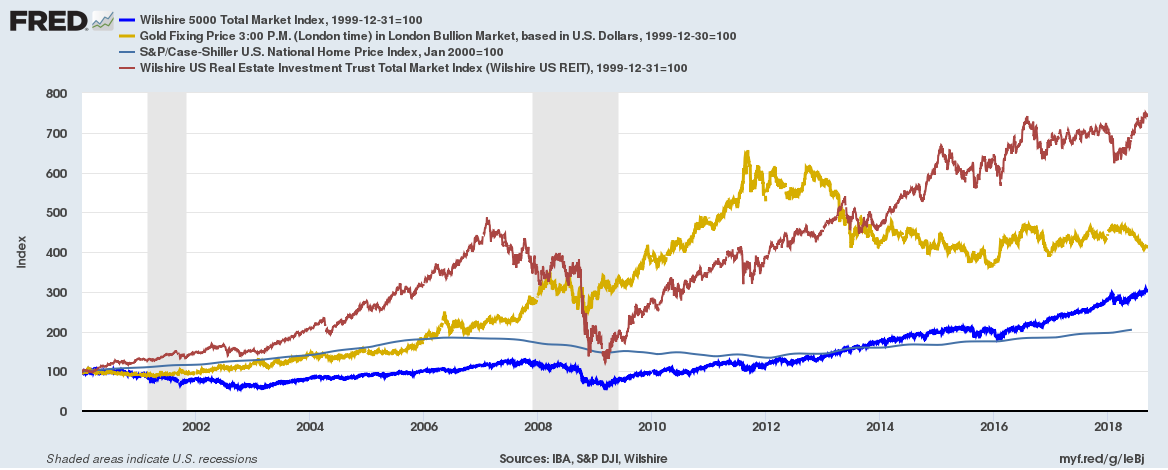
If you had invested $100 on January 1st 2000, you would have
Wilshire 5000 Total Market Index: $304
Wilshire US Real Estate Investment Trust Index: $749
Case-Shiller U.S. National Home Price Index: $205
Gold: $412
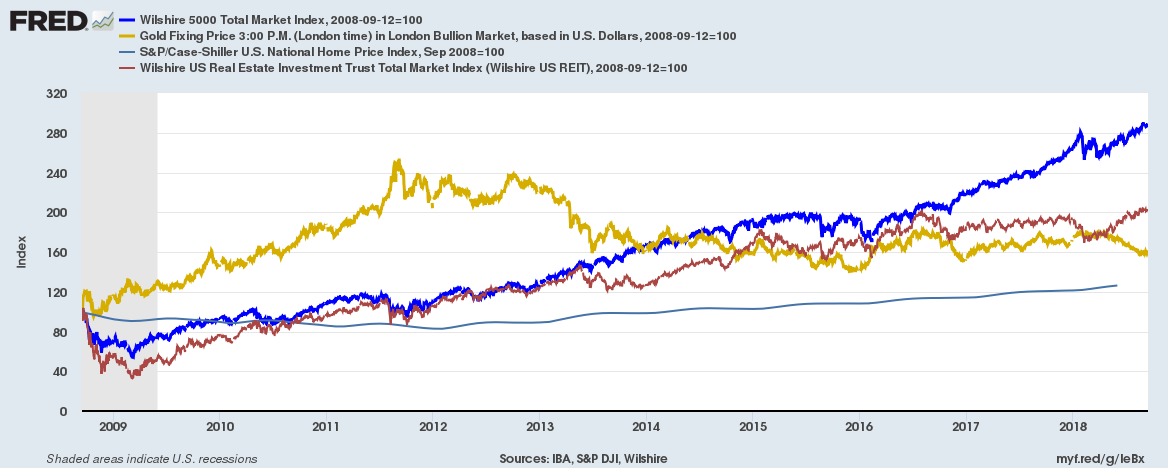
If you had invested $100 on September 14th 2008 (Lehman Brothers declared Chapter 11 Restructuring on September 15th), you would have
Wilshire 5000 Total Market Index: $286
Wilshire US Real Estate Investment Trust Index: $202
Case-Shiller U.S. National Home Price Index: $121
Gold: $160
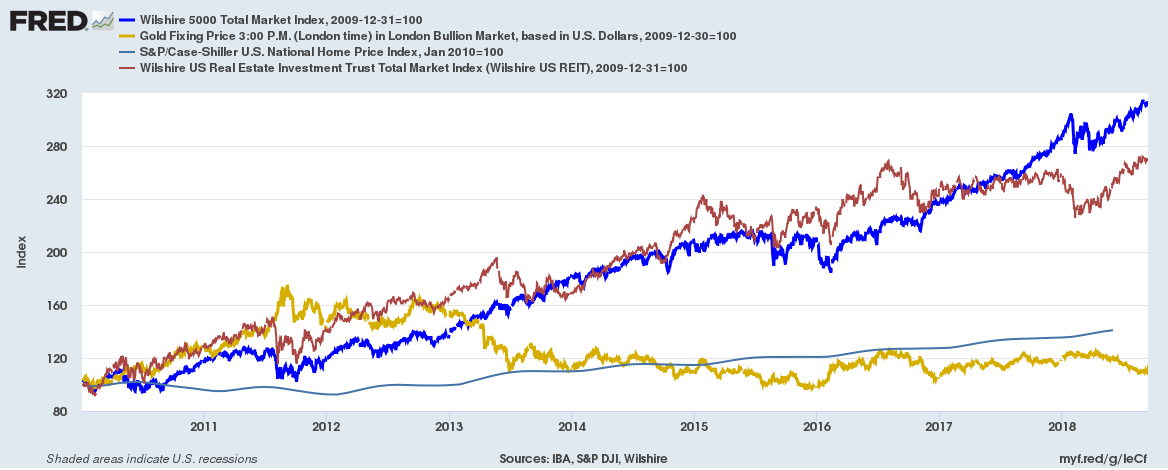
If you had invested $100 on January 1st 2010, you would have
Wilshire 5000 Total Market Index: $310
Wilshire US Real Estate Investment Trust Index: $270
Case-Shiller U.S. National Home Price Index: $138
Gold: $112
Related: