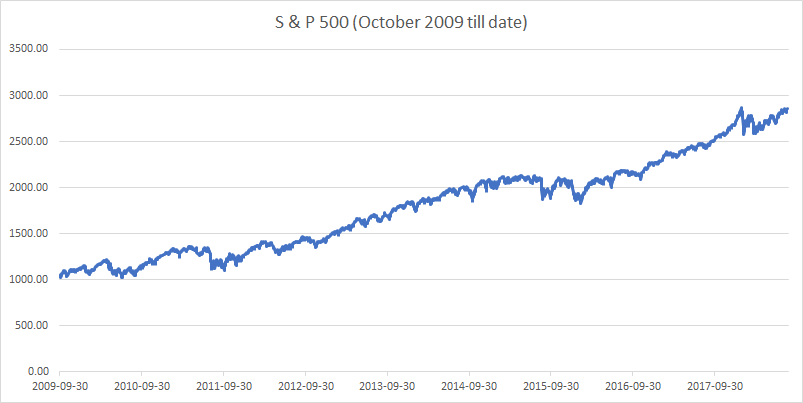
The S & P 500 has had a stellar run of nine and a half years of gains closing at a new high in the week gone by. It is up 300% since the 9th of March 2009 when it hit a multi-year low in the aftermath of the financial crisis. Even considering the time post the end of the last U.S. recession, the S & P 500 has outperformed every major financial metric by a big margin.
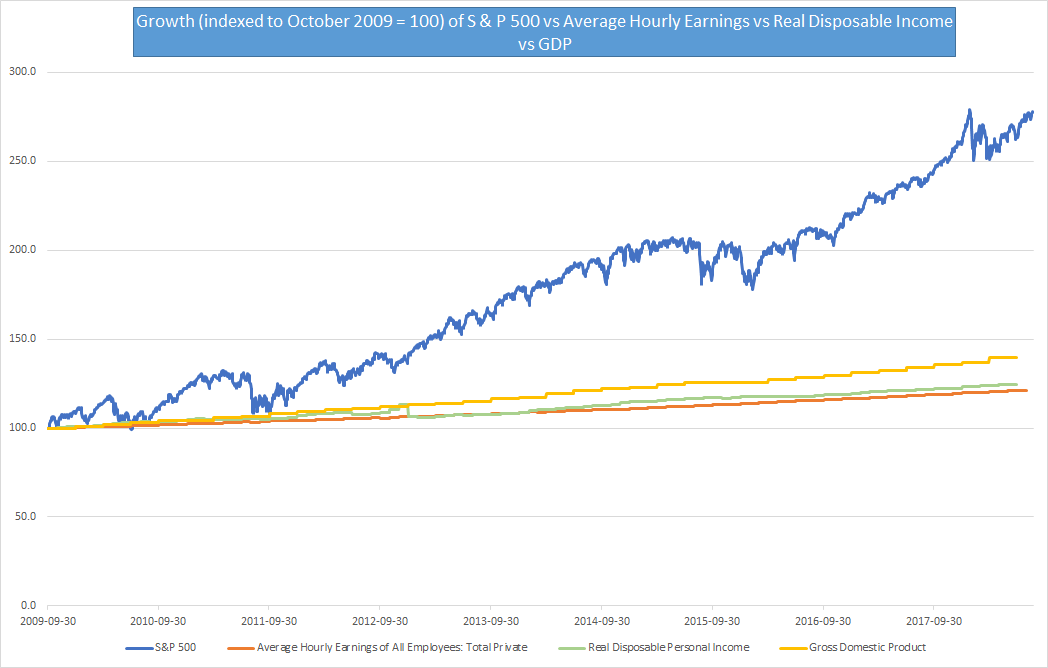
We could have considered the growth of these metrics from the March 2009 low but technically the U.S. was still in a recession then so have considered the period beginning October 1st, 2009 when the U.S. officially exited the recession.
The S & P 500 has had a great run,
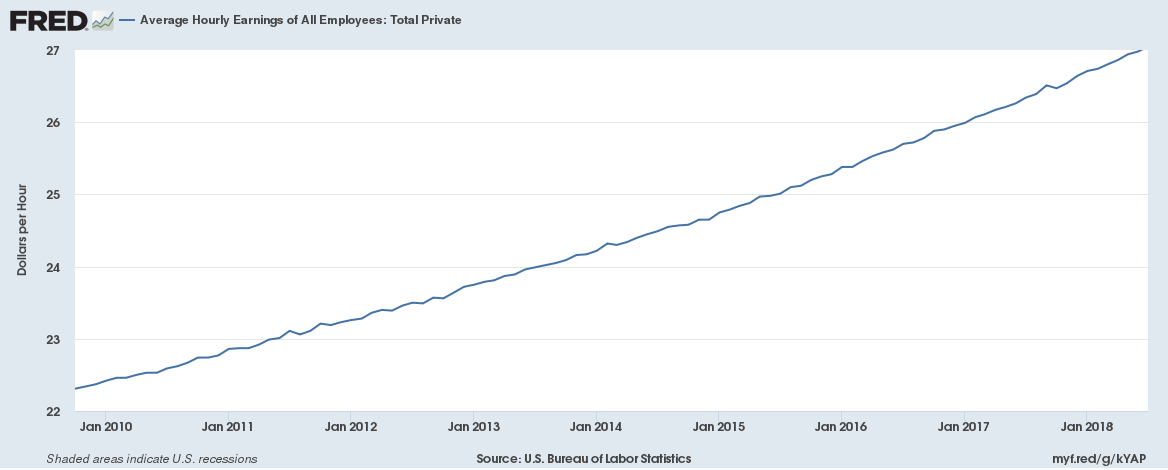
While average hourly wages haven’t,
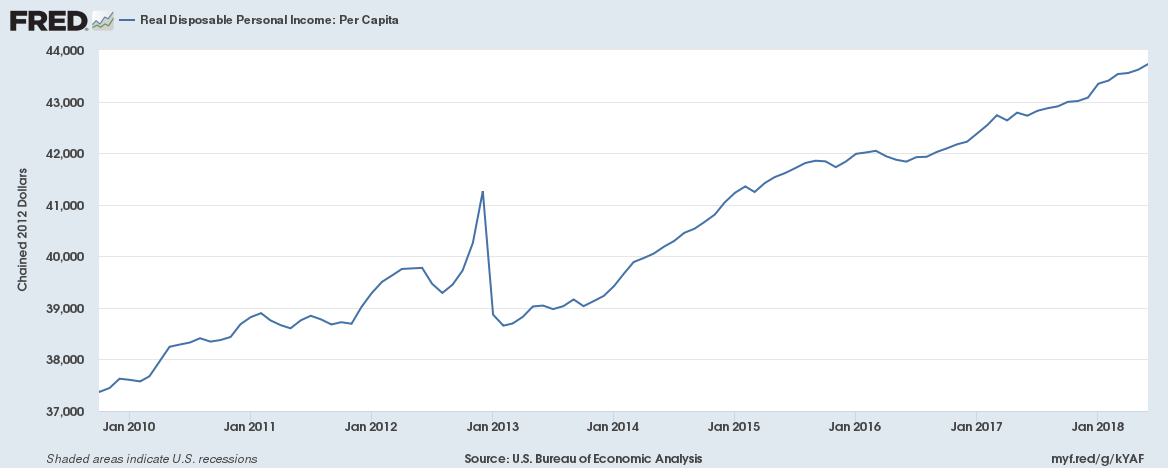
Neither has personal disposable income per capita,
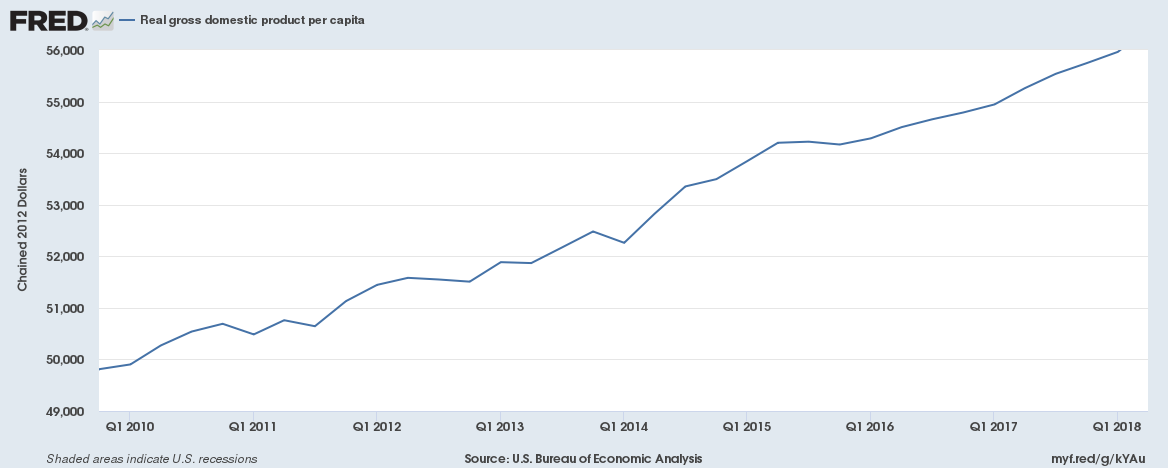
Nor has GDP per capita,
What is driving the great stock market run?
Pension Funds
Underfunding, lower bond yields and changing demographics means a looming pension crisis. How to fix the pension deficits? Buy more stocks …
Lack of stocks to buy
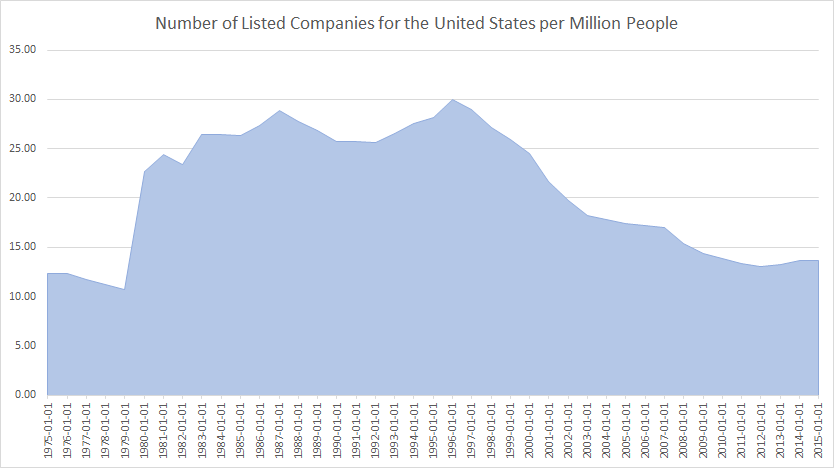
There are far fewer listed companies globally now then there were 20 years ago. 20 years ago, there were over 8000 stock market listed companies in the US, that number has halved by 2018.
In the US the top 200 companies (exchange listed and private) account for around 90% of all corporate profits. Again, with very little choice, valuations are soaring especially for the very big listed companies.
Corporate profit margins and profitability have never been bigger
Corporate profit margins for listed companies in the US that have reported Q2 2018 earnings so far has been over 12.8%, the largest margin on record.
Central Banks buying stocks
Both the Swiss National Bank and the Bank of Japan have negative interest rates (-0.75% for Switzerland and -0.10% for Japan) and have done a lot of Quantitative Easing in the last 5 years. Both have a balance sheet greater than the GDP of their respective countries with Bank of Japan’s balance sheet 101% of GDP of Japan and the Swiss National Bank with a balance sheet of 125% of GDP of Switzerland. What do they do with freshly printed money?
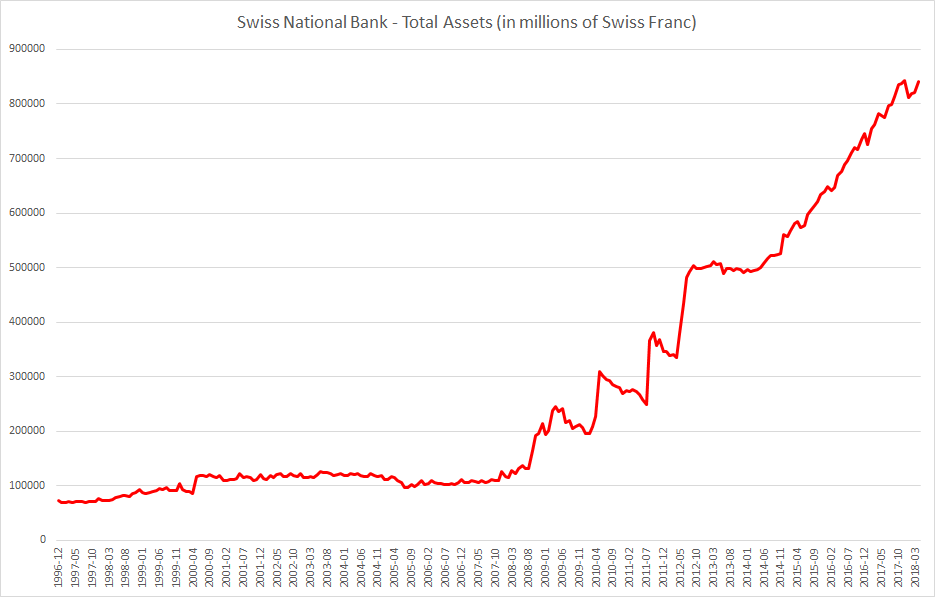
The Swiss National Bank has around $900 billion in foreign currency investments. Amongst its famous holdings are a $5 billion investment in Apple (and it has been buying more shares) and $2 billion investment in Facebook. It made a profit of 54 billion Swiss Francs ($55 billion) for the 2017 financial year mainly down to its overseas equities investments.
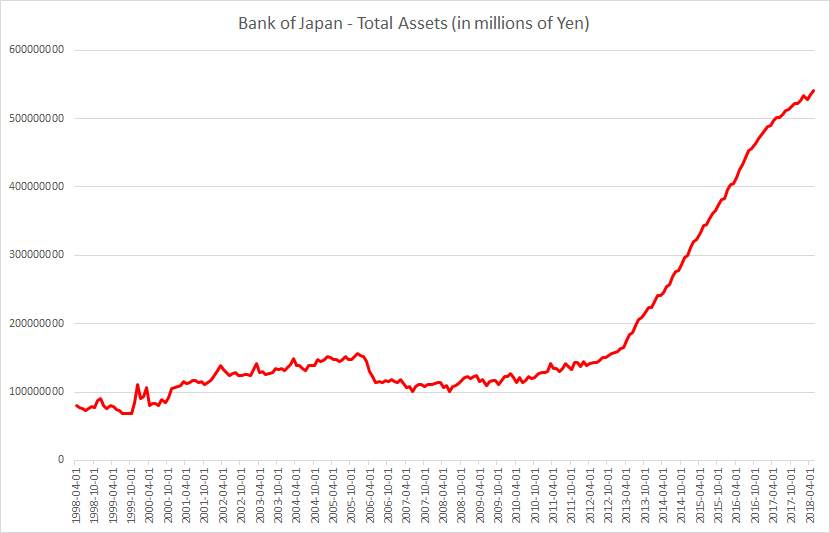
The Bank of Japan has a target to buy 6 trillion Yen ($54 billion) worth of exchange traded funds a year. It now holds almost 82% of all ETFs in Japan and is indirectly the largest shareholder in many large Japanese companies, almost about half of listed companies.
Central Banks don’t just manage monetary policy now, they are also major shareholders in private corporations.
Corporate Stock buybacks
Corporate Stock buybacks were almost $1 trillion in 2017 and are expected to exceed $1 trillion this year despite companies borrowing money to buy back their own stock (and despite rising interest rates).
Related: