Records are being broken shattered …
Continue reading “The U.S. equity market meltdown in numbers”
Why wouldn’t it be?
Records are being broken shattered …
Continue reading “The U.S. equity market meltdown in numbers”
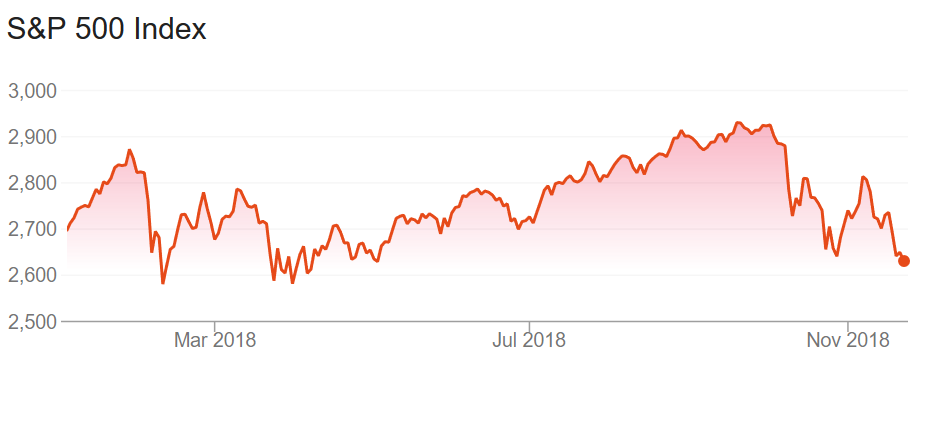
We look back at 2018 year end S&P 500 targets as 2018 draws to a close. The S&P 500 is currently down about 3% year to date and unless something drastic happens almost every major Wall Street strategist will be way off with their target for the S&P 500 for 2018. We also look at 2019 targets which are all bullish again. Will the predictions for 2019 be any better on target than they were for 2018?
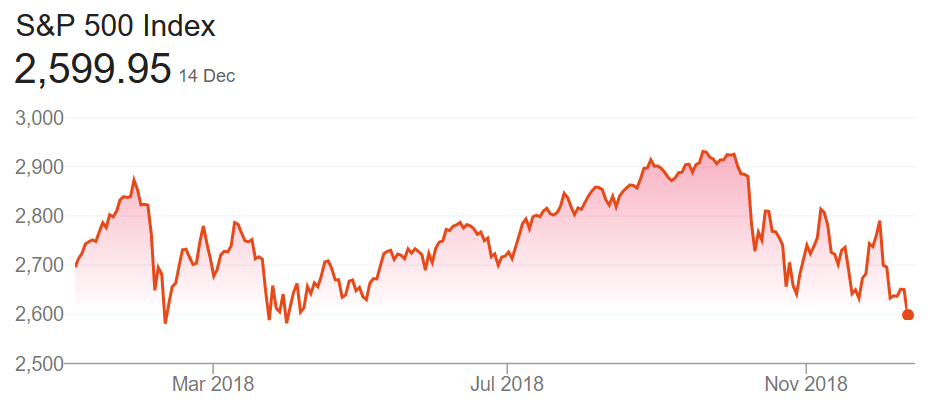
The S & P 500 and the NASDAQ 100 hit all time highs in early October and since then they have fallen about 10% each. The S & P 500 has turned negative for the year and the NASDAQ 100 has barely moved. FAANG (Facebook, Amazon, Apple, Netflix and Google/Alphabet) stocks accounted for almost all the 2018 gains until October. And their fall has caused the market meltdown but there is more to the story …
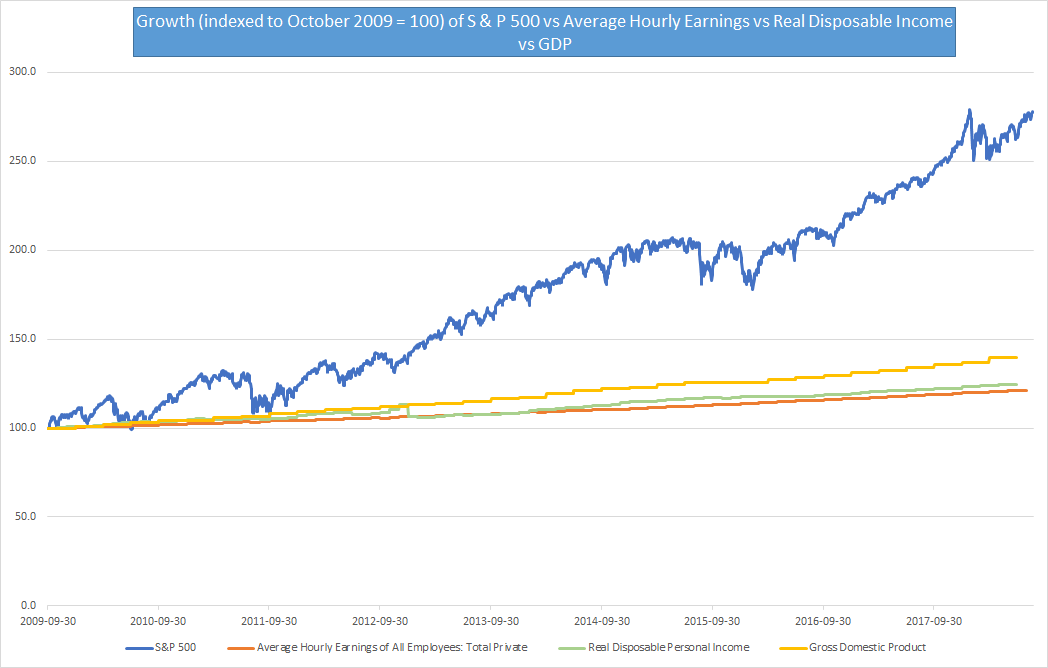
The S & P 500 has had a stellar run of nine and a half years of gains closing at a new high in the week gone by. It is up 300% since the 9th of March 2009 when it hit a multi-year low in the aftermath of the financial crisis. Even considering the time post the end of the last U.S. recession, the S & P 500 has outperformed every major financial metric by a big margin.
Most major stock indices have recently hit all time highs. Many of the 2018 year end S & P 500 targets were hit in just 15 trading days. Continue reading “Real reasons why stock markets are soaring”