We will be publishing a number of statistics for the United Kingdom (and the European Union) over the next few days in the run up to a major piece we will be publishing on the real economics of Brexit.
Share of global GDP
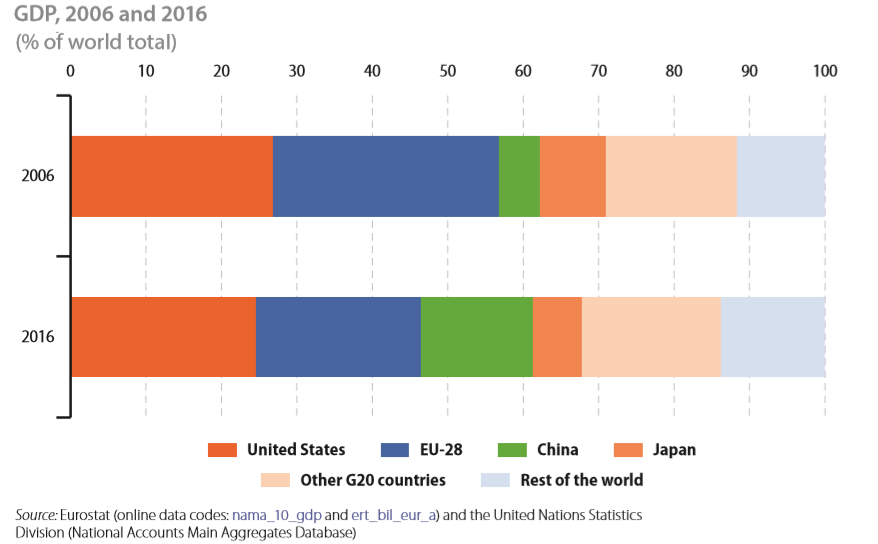
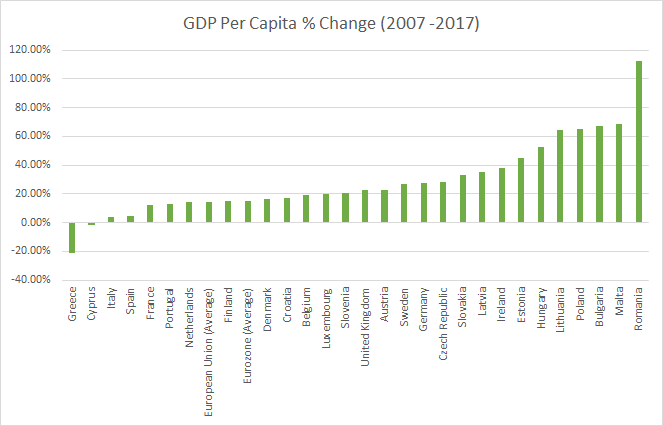
The European Union’s share of global GDP fell from 30% in 2006 to 22% in 2016. Parts of the EU have seen GDP per capita shrink and the overall compounded annual growth rate was just 1.2% between 2007 and 2017. GDP growth adjusted for inflation was negative. (Read More: Parts of the European Union have seen nominal GDP per capita fall between 2007 and 2017)
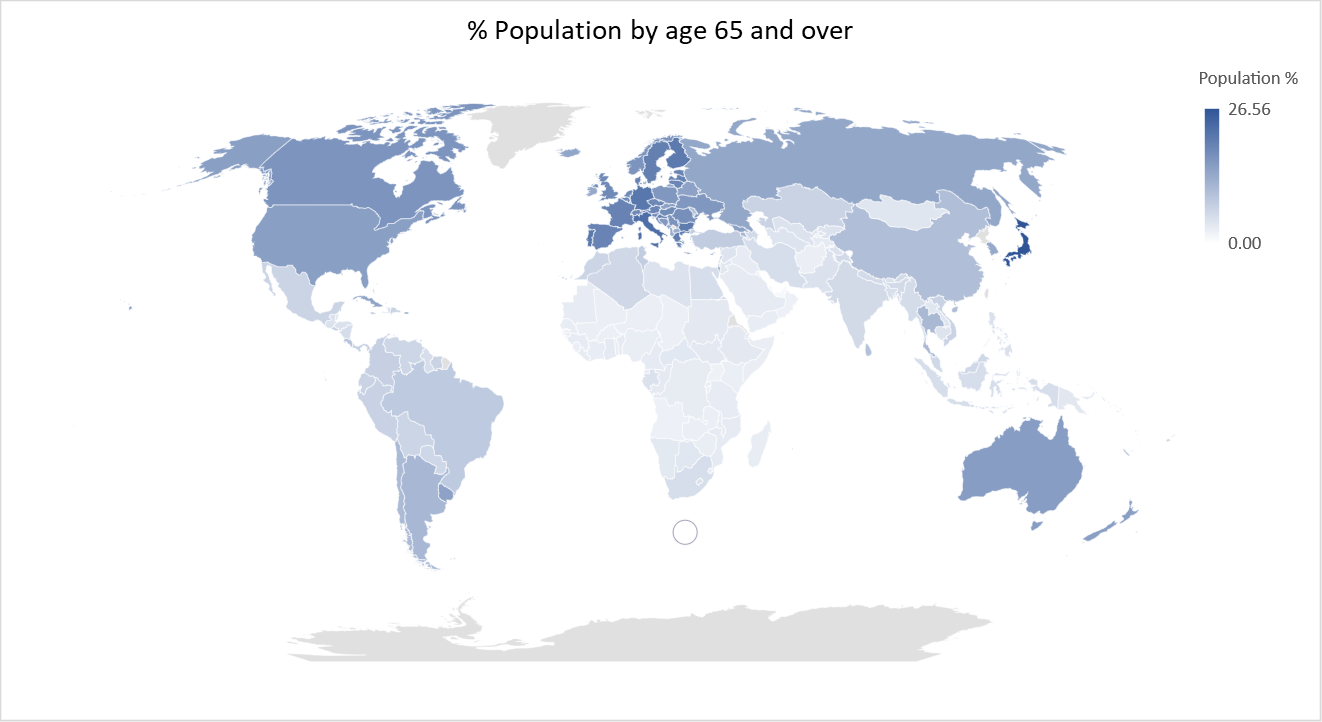
Share of World’s population
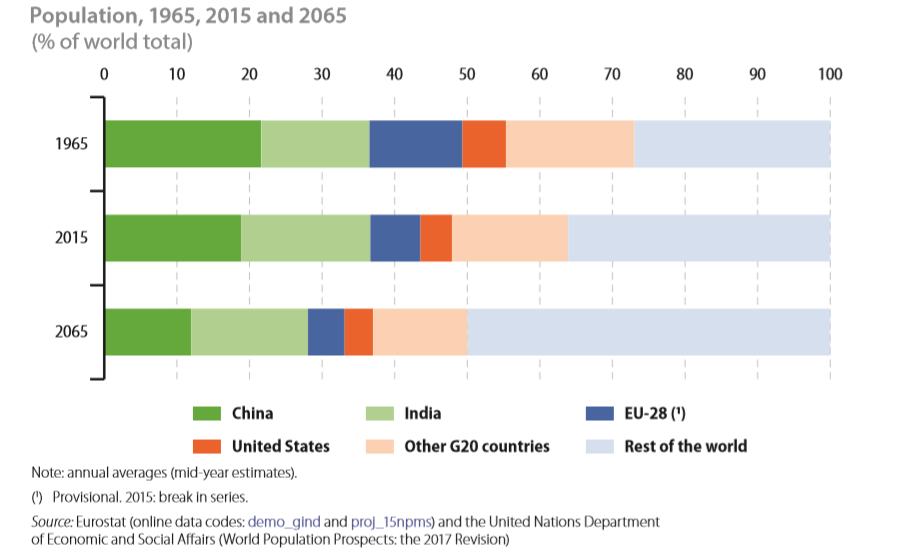
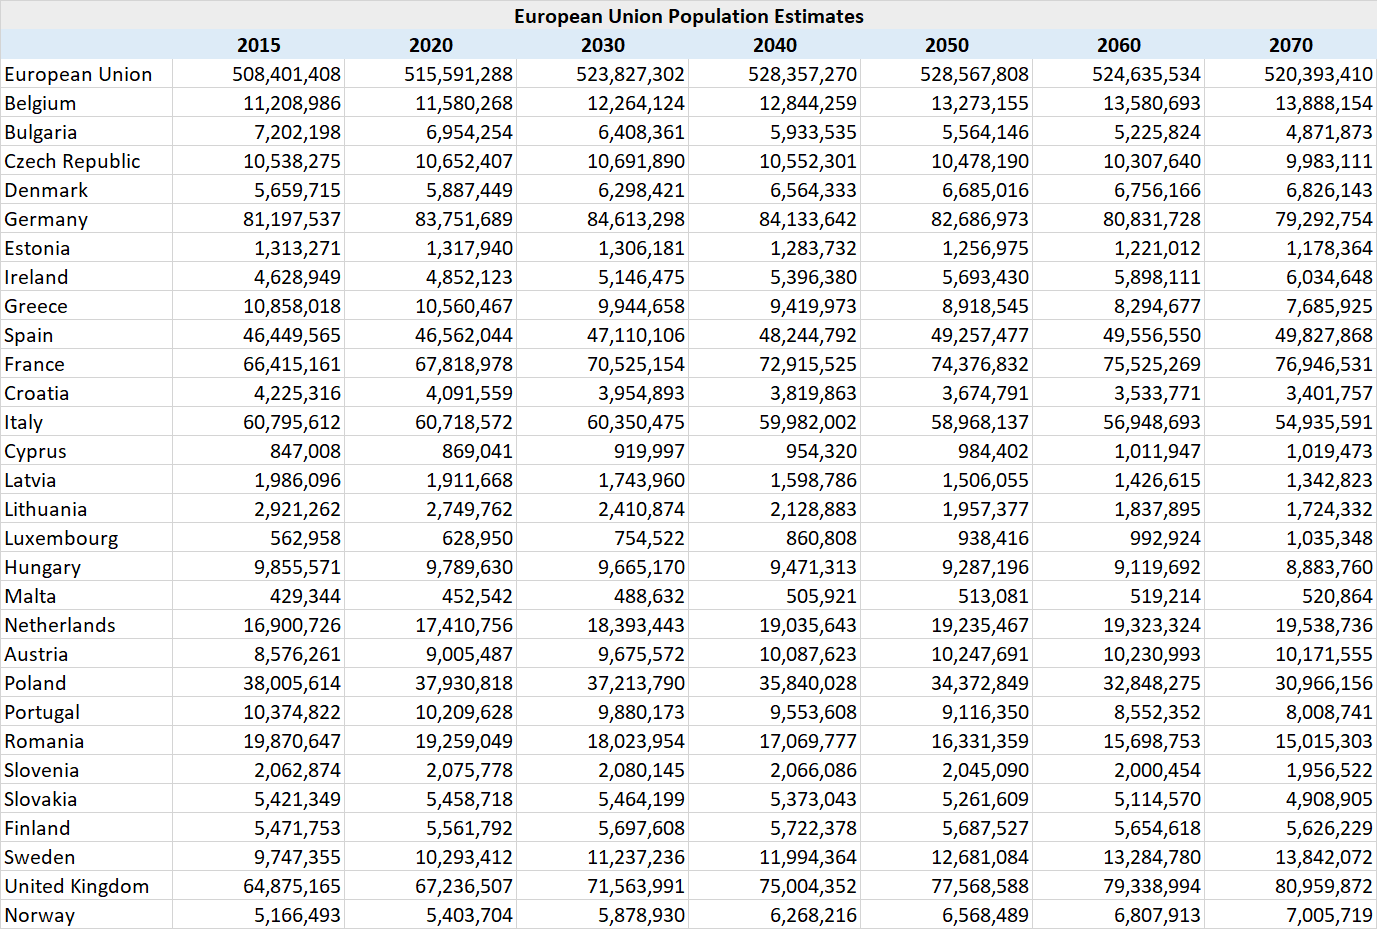
The European Union’s share of the world’s population is projected to fall from 6.9% in 2015 to 5.0% by 2065.
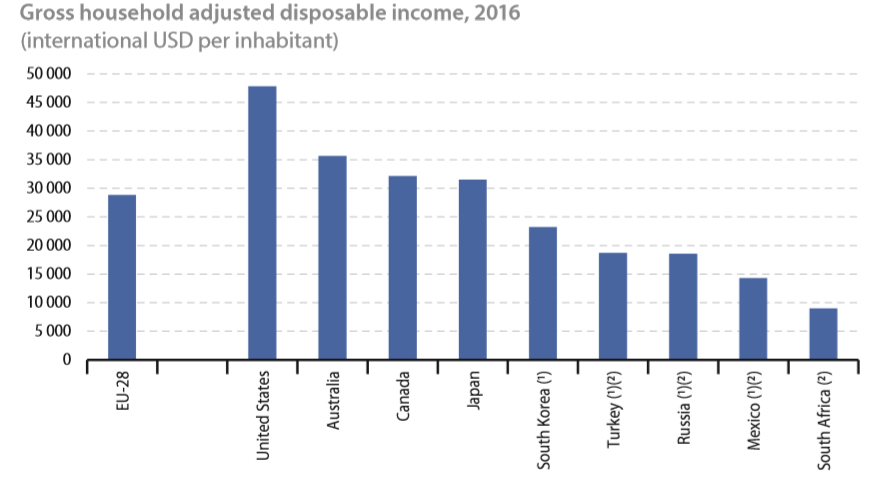
Household adjusted disposable income
Household adjusted disposable income reflects a household’s gross income including social transfers in-kind received (such as education and healthcare) minus taxes on income and wealth and social security contributions. Furthermore, these data have been adjusted to reflect differences in
purchasing power between countries, in other words differences in price levels. This adjustment is done by converting data in national currencies to a common currency — United States dollars in this case — using purchasing power parities (PPPs) rather than market exchange rates. In 2016, the United States had the highest annual household adjusted income per inhabitant among the G20 members, followed at some distance by Australia, Canada, Japan and the European Union.
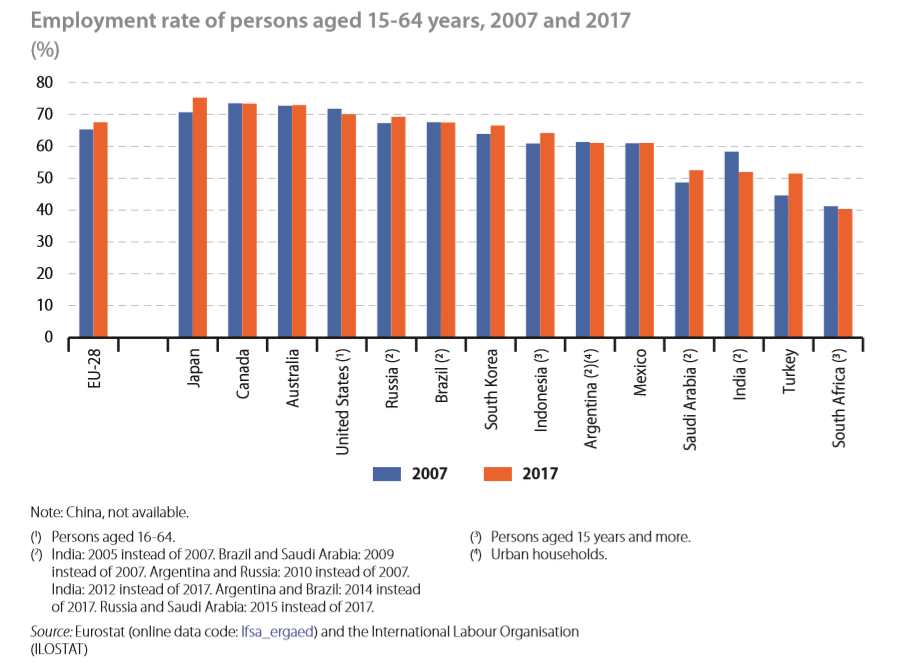
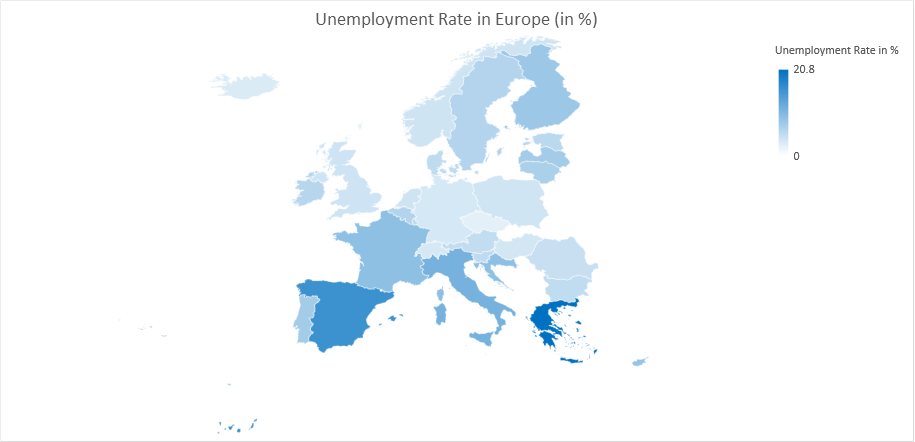
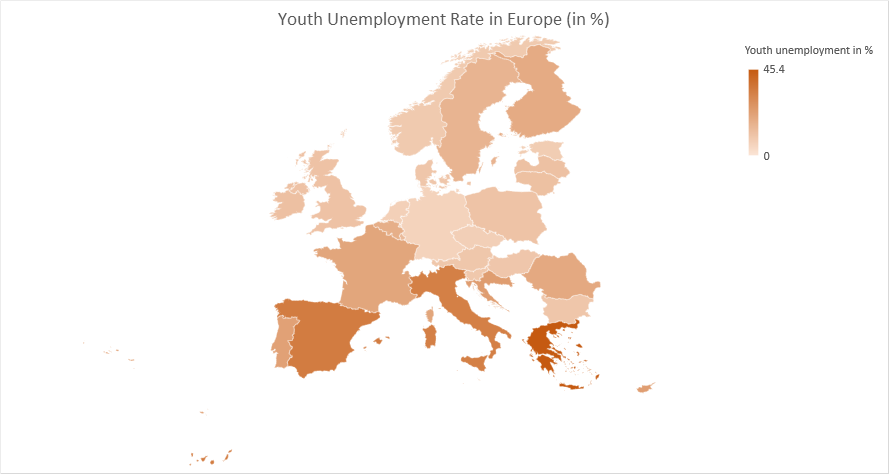
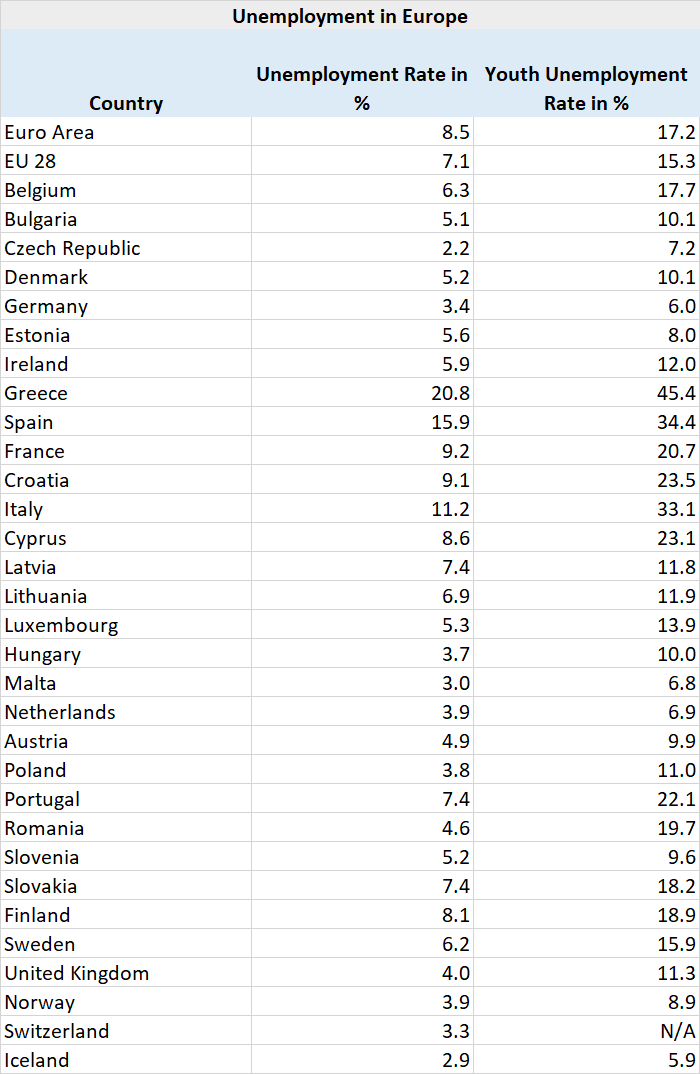
Employment Rate
The employment rate, calculated as the share of employed persons in the total population of working age (defined here as persons aged 15-64 years), was 67.6 % in 2017 in the European Union. Between 2007 and 2017 the employment rate for the European Union increased 2.3 percentage points from 65.3%. Youth unemployment remains a big issue though. (Read more: Unemployment in Europe is lowest since 2008 but is still twice that of the United States)
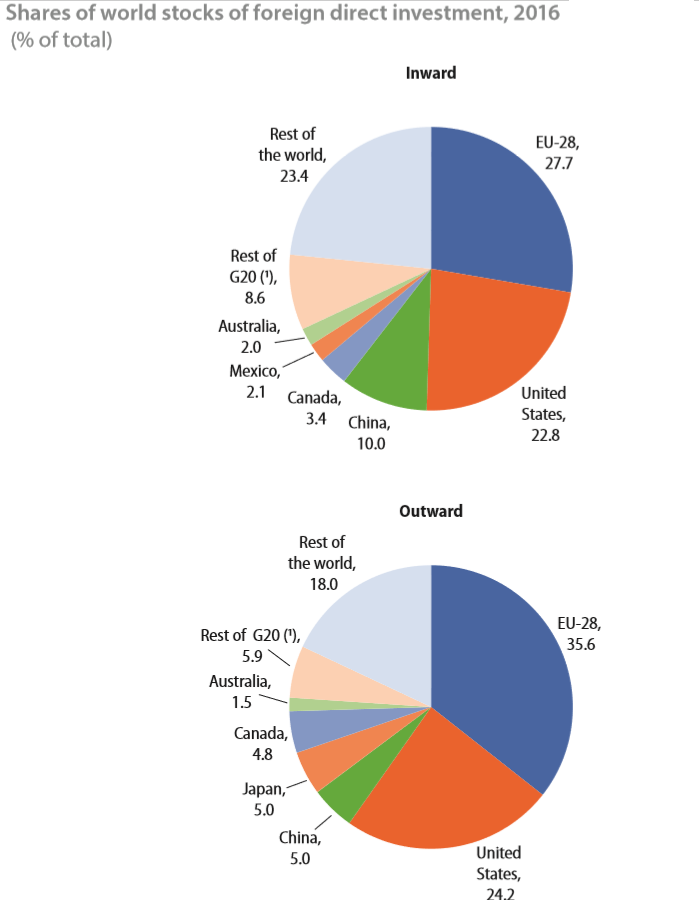
Foreign Direct Investment (FDI)
The European Union had the largest inward FDI but also the largest outward FDI (by a big margin) in 2016.
The European Union (EU28) includes Belgium, Bulgaria, the Czech Republic, Denmark, Germany, Estonia, Ireland, Greece, Spain, France, Croatia, Italy, Cyprus, Latvia, Lithuania, Luxembourg, Hungary, Malta, the Netherlands, Austria, Poland, Portugal, Romania, Slovenia, Slovakia, Finland, Sweden and the United Kingdom.
Related: