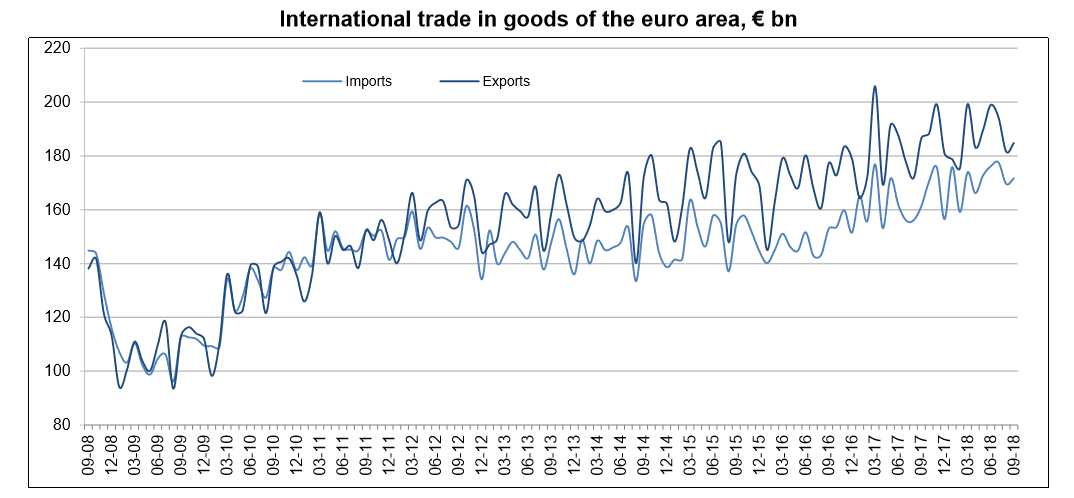
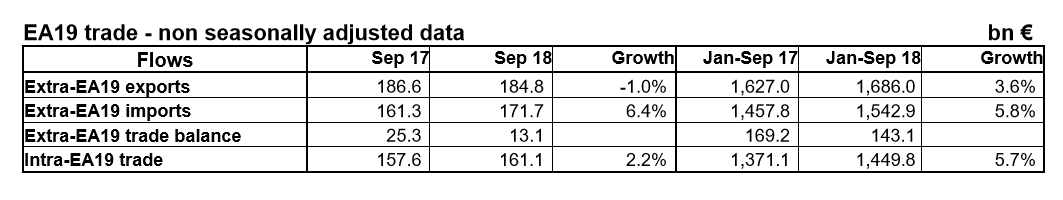
In January to September 2018, Euro area or Eurozone exports of goods to the rest of the world rose to €1,686.0 bn (an increase of 3.6% compared with January to September 2017), while imports rose to €1,542.9 bn (an increase of 5.8% compared with January to September 2017). As a result, the euro area recorded a surplus of €143.1 bn, compared with +€169.2 bn in January-September 2017. Intra-euro area trade rose to €1,449.8 bn in January-September 2018, up by 5.7% compared with January-September 2017.
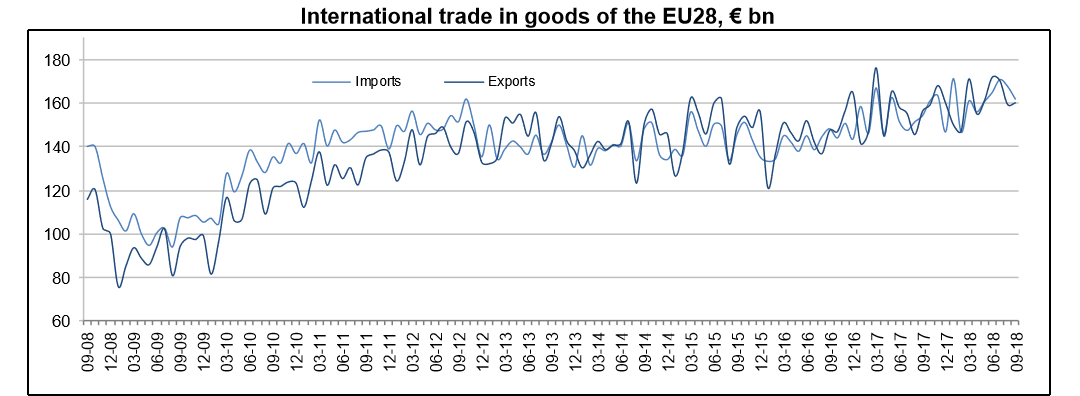
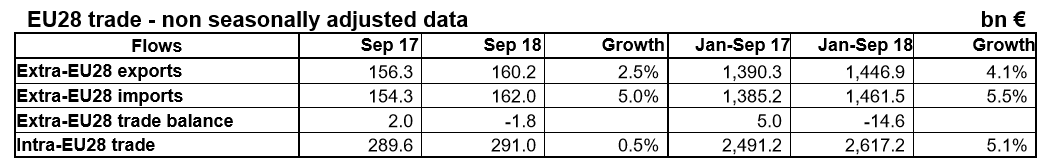
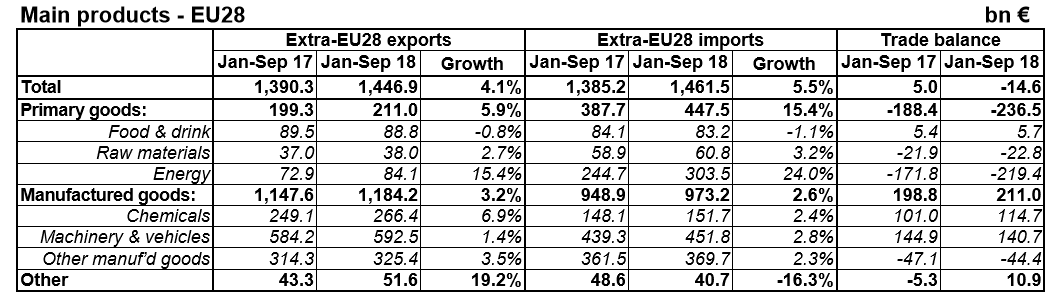
In January to September 2018, extra-EU28 exports of goods rose to €1,446.9 bn (an increase of 4.1% compared with January to September 2017), while imports rose to €1,461.5 bn (an increase of 5.5% compared with January to September 2017). As a result, the EU28 recorded a deficit of €14.6 bn, compared with a surplus of €5.0 bn in January-September 2017. Intra-EU28 trade rose to €2,617.2 bn in January-September 2018, up by 5.1% compared with January-September 2017.
Trade by Product
Meanwhile, the trade deficit on energy grew from €171.8 bn in January to September 2017 to €219.4 bn in January to September 2018, an increase of 28%.
Trade by Partner
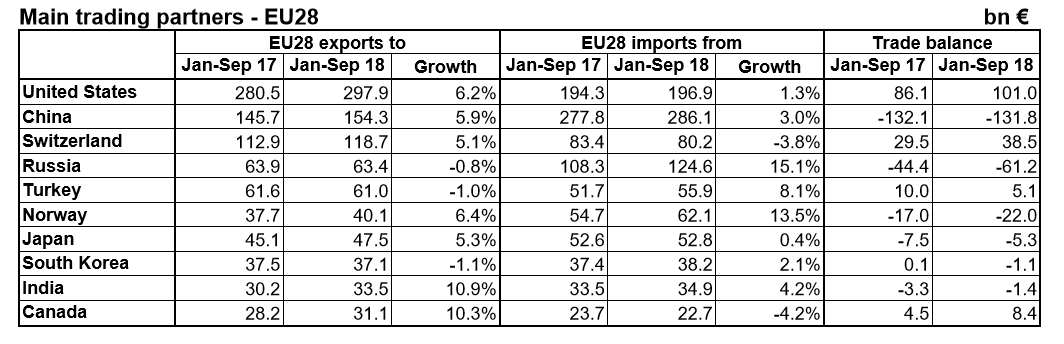
The trade surplus with the U.S. grew by 18% from €81.6 bn in January to September 2017 to €101 bn in January to September 2018 (despite rising U.S. import tariffs).
The trade deficit with Russia expanded by 38% from €44.4 bn in January to September 2017 to €61.2 bn in January to September 2018.
Complete Dataset
The European Union (EU28) currently includes Belgium, Bulgaria, the Czech Republic, Denmark, Germany, Estonia, Ireland, Greece, Spain, France, Croatia, Italy, Cyprus, Latvia, Lithuania, Luxembourg, Hungary, Malta, the Netherlands, Austria, Poland, Portugal, Romania, Slovenia, Slovakia, Finland, Sweden and the United Kingdom.
The euro area (EA19) currently includes Belgium, Germany, Estonia, Ireland, Greece, Spain, France, Italy, Cyprus, Latvia, Lithuania, Luxembourg, Malta, the Netherlands, Austria, Portugal, Slovenia, Slovakia and Finland.
Related:
Do nations with balance of payments or trade surpluses really outperform those with deficits?
All you wanted to know about US trade in 2017 and why China matters so much
14 very interesting things about U.S. trade and trade tariffs
The U.S. only charged 1.65% in import tariffs in 2017
Average import tariffs or custom duties per country