The first estimate of Euro area or Eurozone (EA19) and European Union (EU28) trade statistics by Eurostat for 2018 reveals several interesting insights.
Eurozone 2018 Summary Trade Statistics
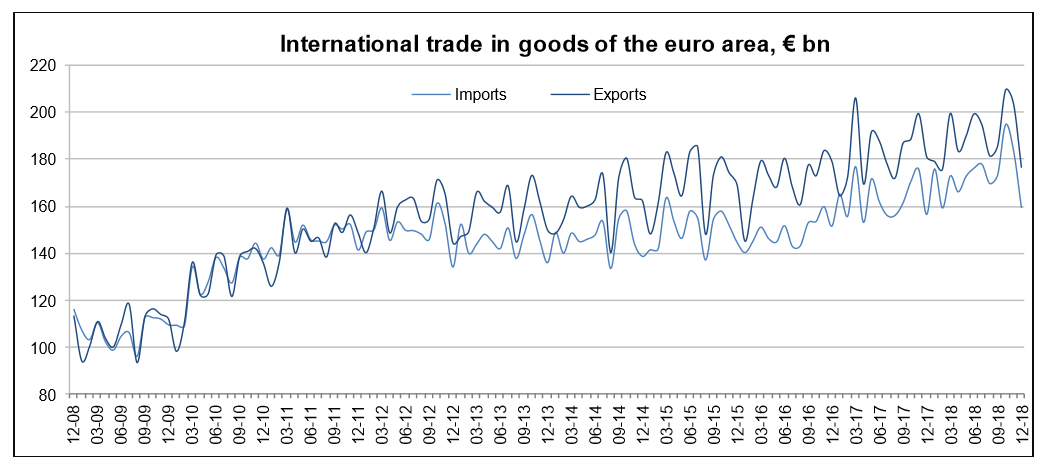
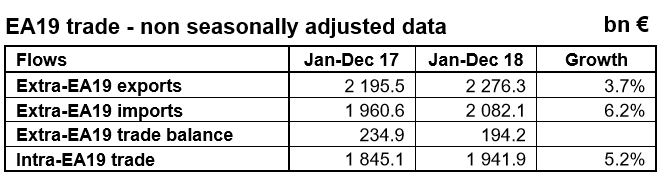
In January to December 2018, Eurozone exports of goods to the rest of the world rose to €2,276.3 billion (an increase of 3.7% compared with January to December 2017), and imports rose to €2,082.1 billion (an increase of 6.2% compared with January to December 2017). As a result, the Eurozone recorded a surplus of +€194.2 billion, compared with +€234.9 billion in January to December 2017. Intra-Eurozone trade rose to €1,941.9 billion in January to December 2018, up by 5.2% compared with January to December 2017.
European Union 2018 Summary Trade Statistics
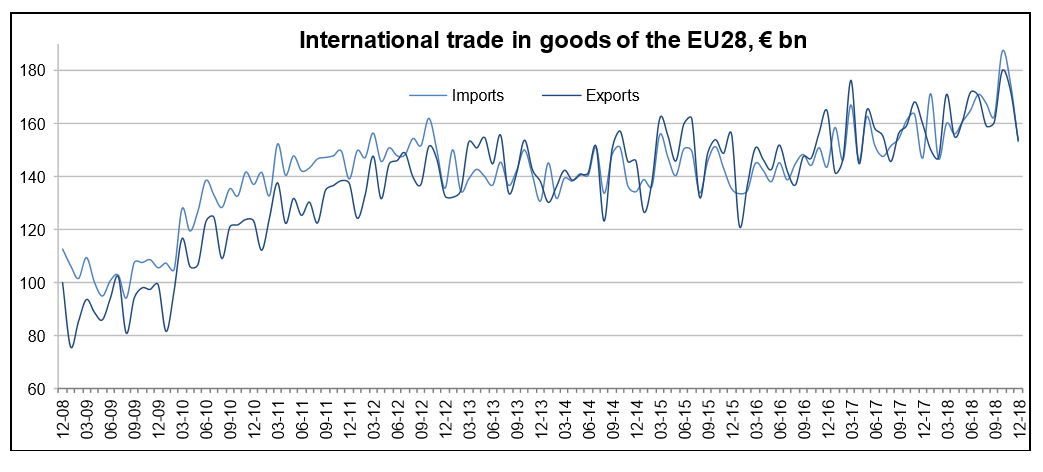
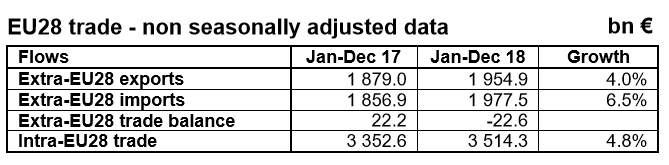
In January to December 2018, European Union (EU28) exports of goods rose to €1,954.9 billion (an increase of 4.0% compared with January to December 2017), and imports rose to €1,977.5 billion (an increase of 6.5% compared with January to December 2017). As a result, the EU28 recorded a deficit of €22.6 billion, compared with a surplus of €22.2 billion in January to December 2017. Intra-EU28 trade rose to €3,514.3 billion in January to December 2018, +4.8% compared with January to December 2017.
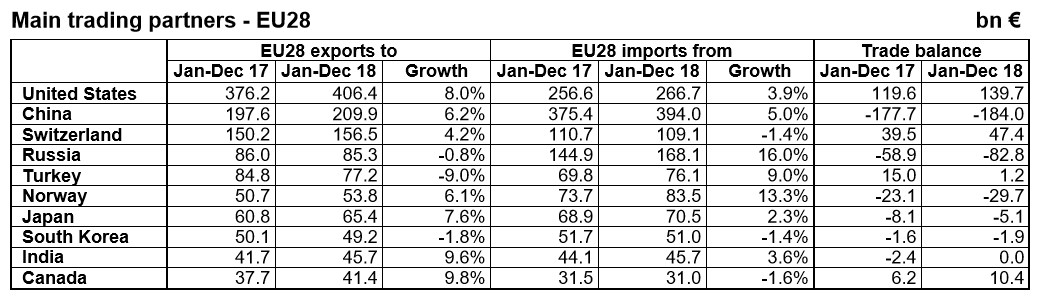
European Union 2018 trading partners
The EU28 reported a record €139.7 billion trade surplus with the U.S. in 2018 (up 16.8% from €119.6 billion in 2017). Exports to the U.S. were up 8% but imports only rose 3.9%. The U.S. remains the largest trading partner for the EU28.
The EU28 reported a record €82.8 billion trade deficit with Russia in 2018 (up from €58.9 billion in 2017). Exports to Russia fell 0.8% but imports increased 16%. The EU28 is heavily reliant on energy imports from Russia.
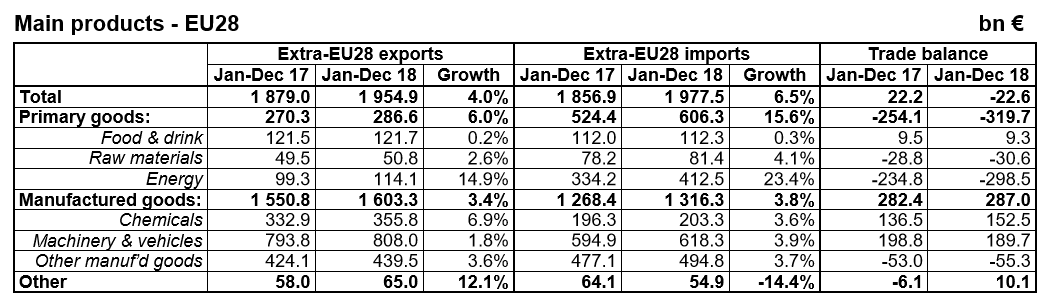
European Union 2018 trade by product
The main story here was Energy. The EU28 is heavily reliant on Russia for energy imports. As Germany and other EU28 nations move from nuclear energy to gas powered energy, the reliance on Russia is only going to increase further. Energy imports were up 23.4% during 2018 and the EU28 had a €298.5 billion trade deficit for energy.
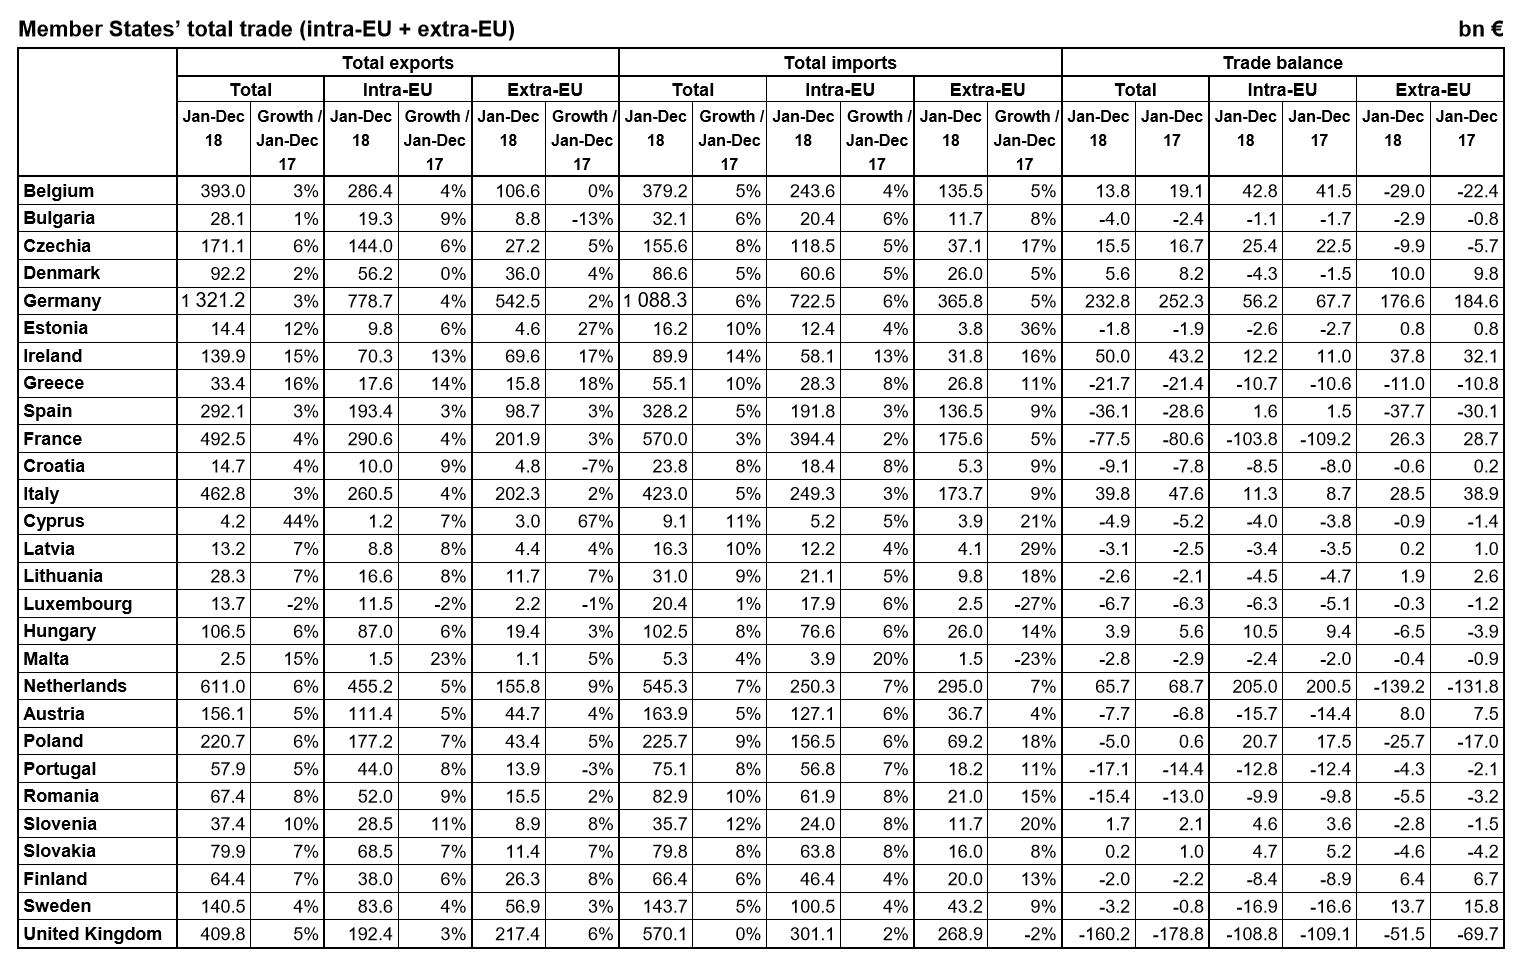
European Union 2018 trade statistics for each member state
UK had the largest intra-EU trade deficit in 2018 at €108.8 billion.
Germany had the largest overall trade surplus (€232.8 billion) and the UK had the largest trade deficit (€160.2 billion).
UK exports grew 5% overall in 2018 over 2017 with exports to the EU28 growing at 3% and exports with the rest of the world growing at 6%. Overall imports were flat.
Related:
Do nations with balance of payments or trade surpluses really outperform those with deficits?
All you wanted to know about US trade in 2017 and why China matters so much
14 very interesting things about U.S. trade and trade tariffs
The U.S. only charged 1.65% in import tariffs in 2017
Average import tariffs or custom duties per country
The Eurozone or Euro area (EA19) currently includes Belgium, Germany, Estonia, Ireland, Greece, Spain, France, Italy, Cyprus, Latvia, Lithuania, Luxembourg, Malta, the Netherlands, Austria, Portugal, Slovenia, Slovakia and Finland.
The European Union (EU28) currently includes Belgium, Bulgaria, Czechia (formerly the Czech Republic), Denmark, Germany, Estonia, Ireland, Greece, Spain, France, Croatia, Italy, Cyprus, Latvia, Lithuania, Luxembourg, Hungary, Malta, the Netherlands, Austria, Poland, Portugal, Romania, Slovenia, Slovakia, Finland, Sweden and the United Kingdom.