Just three charts hold the answer …
We wrote earlier during the year that U.S. consumer and commercial debt hit record highs but charge-off and delinquency rates remained at low levels. We will write about bad loans by each product again in the new year but meanwhile just three charts hold the answer to the question on whether bad loans are really increasing for banks in the United States.
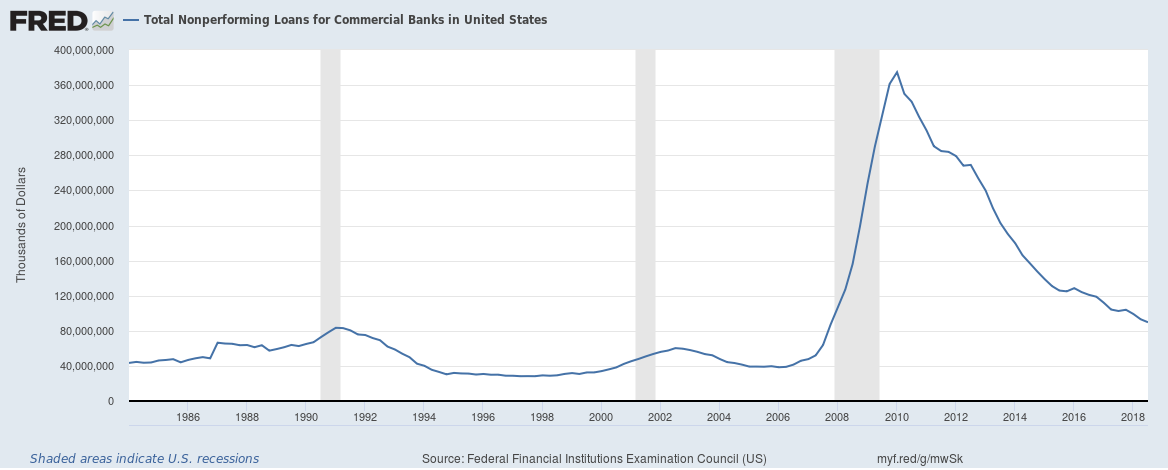
Absolute value of total non-performing loans (past due 90+ days)

Total non-performing loans stood at an absolute value of $90 billion at the end of Q3 2018. The number has been falling and is way down from $375 billion at the end of Q1 2010.
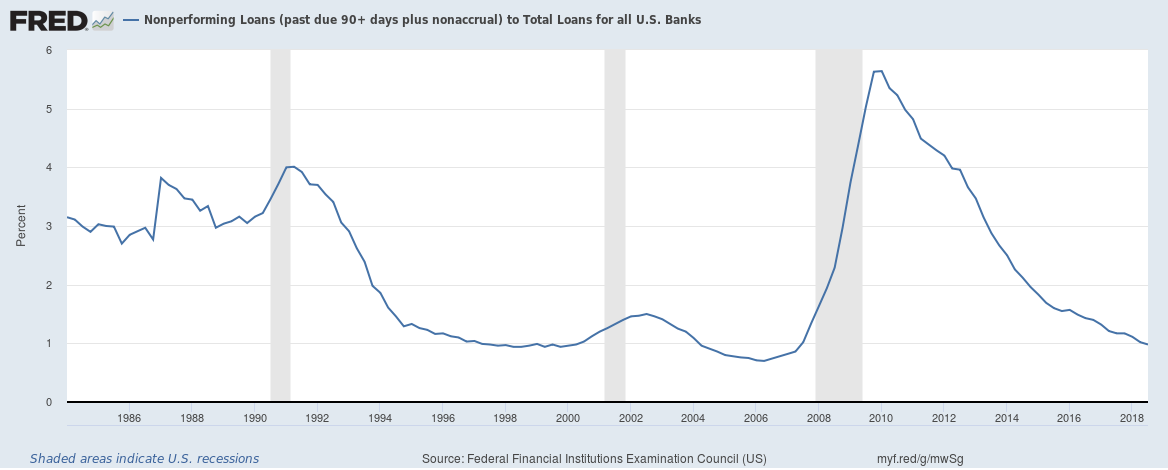
Non-performing loans (past due 90+ days) to total loans ratio

The absolute value of non-performing loans is falling but what about the non-performing loans to total loans ratio? That is falling too, it stood at 0.98 at the end of Q3 2018 and has been falling having peaked at 5.64 at the end of Q1 2010.
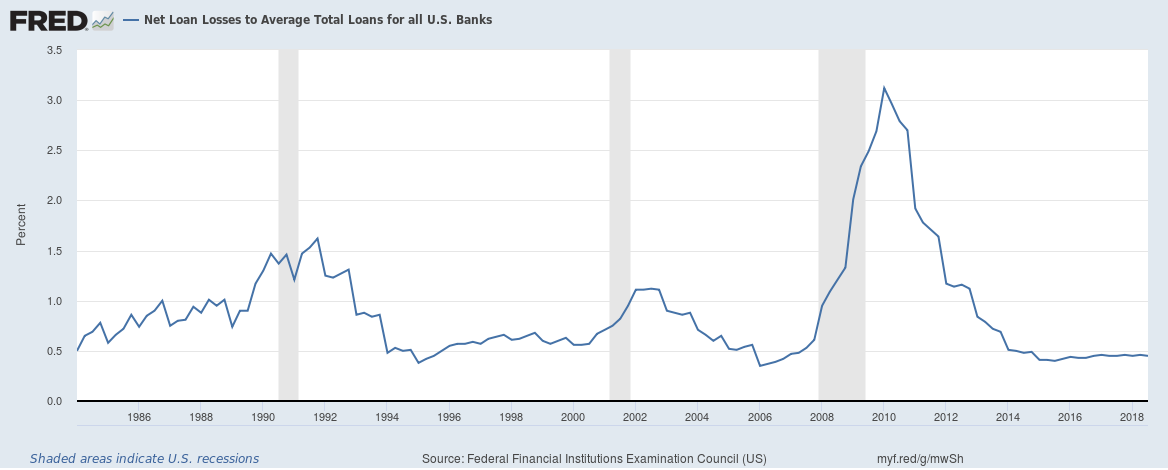
Net Loan Losses to Average Total Loans

Not all non-performing loans are losses, there is recovery of at least some assets particularly for secured loans like mortgages. At the end of Q3 2018, the ratio stood at 0.45 and has been falling having peaked at 3.12 at the end of Q1 2010.
Conclusion: Bad loans are falling for U.S. banks and the loan book quality remains fairly good.
Related:
Banks in the United States have a problem – they can’t find enough customers to lend money to
The curious case of low U.S. money velocity
Here’s why the Federal Reserve increasing interest rates could be a problem
The yield curve inversion plus why banks and banking stocks are impacted by it