Key highlights
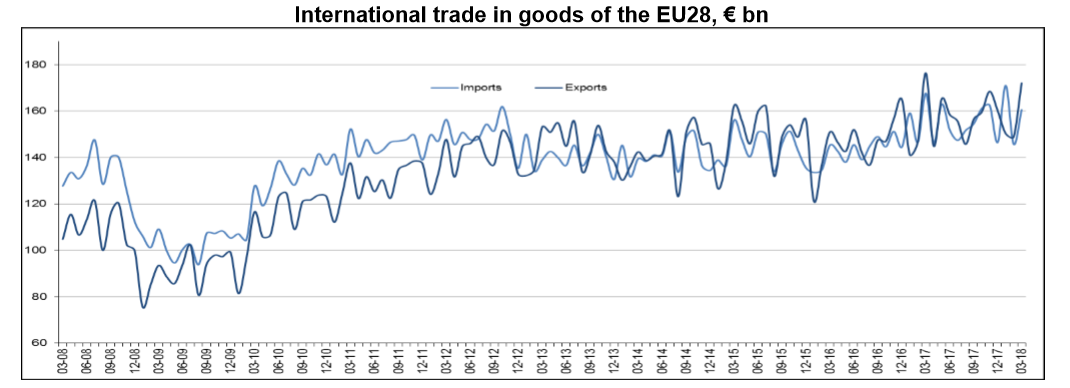
- The total trade surplus for the European Union increased from €15.6 bn in Q1 2017 to €19.1 bn in Q1 2018, total exports were €1.34 trillion and total imports were €1.33 trillion
- 10 of the 28 European Union countries had a trade surplus in Q1 2018 and 18 had a trade deficit
- Germany had the largest trade surplus in Q1 2018 at €62.2 bn, Netherlands at €15.8 bn and Ireland at €12.4 bn
- The United Kingdom had the largest trade deficit in Q1 2018 at €41.1 bn, France at €21.2 bn and Spain at €7.9 bn

Trade by product
- The trade deficit for Energy increased from €65.7 bn in Q1 2017 to €70.1 bn in Q1 2018
- The trade surplus for Chemicals increased from €33.6 bn in Q1 2017 to €42.2 bn in Q1 2018
- The trade surplus for Machinery and vehicles decreased from €45.7 bn in Q1 2017 to €44.6 bn in Q1 2018
Trade by partner country
- The trade surplus with the United States increased from €30.5 bn in Q1 2017 to €36.1 bn in Q1 2018
- The trade deficit with China increased from €43.9 bn in Q1 2017 to €46.5 bn in Q1 2018
- The trade deficit with Russia decreased from €19.5 bn in Q1 2017 to €19.2 bn in Q1 2018

The European Union includes Belgium, Bulgaria, the Czech Republic, Denmark, Germany, Estonia, Ireland, Greece, Spain, France, Croatia, Italy, Cyprus, Latvia, Lithuania, Luxembourg, Hungary, Malta, the Netherlands, Austria, Poland, Portugal, Romania, Slovenia, Slovakia, Finland, Sweden and the United Kingdom