Different measures tell another story:
- Real disposable personal income per capita
- Personal income payments
- Total employee compensation
- Personal consumption expenditures per capita
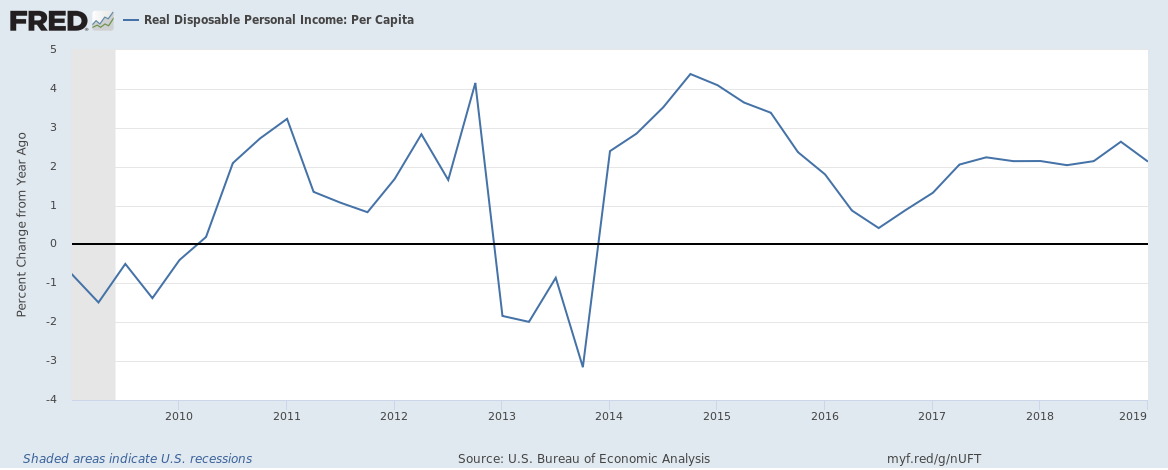
Real disposable personal income per capita
Real Disposable Personal Income Per Capita was up just 2.1% (Seasonally Adjusted Annual Rate) in Q1 2019. The growth rate has halved since 2014.

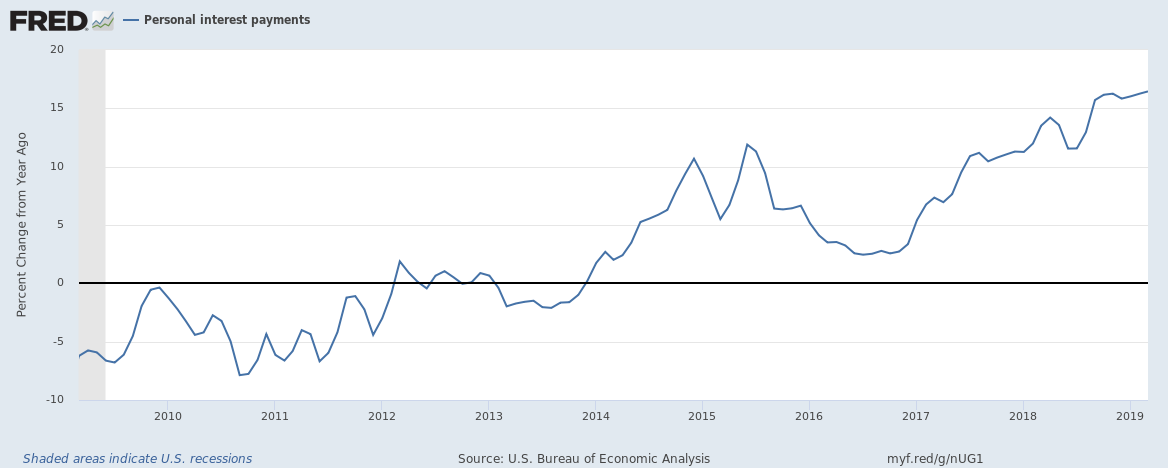
Personal income payments
Rising interest rates means personal interest payments are soaring. Q1 2019 vs Q1 2018 saw a growth of 16.5% in personal interest payments.

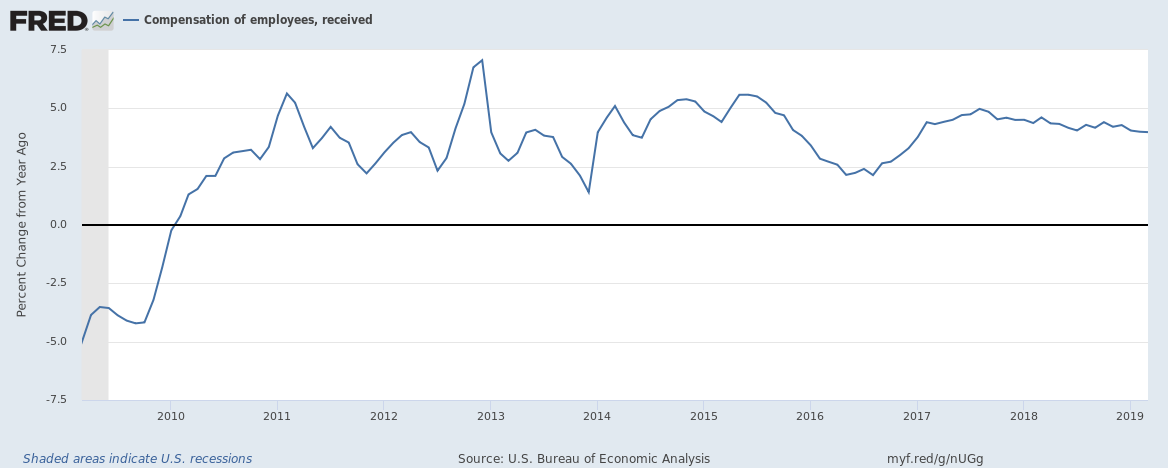
Total employee compensation
There are a few measures to calculate wage growth. The popular one being average hourly wage but what if people get paid more per hour but have fewer hours of work? Another measure is the total compensation of employees (which includes wages, supplements like overtime and bonuses as well as employer health and pension contributions). This is up 4% which is good but not spectacular compared to recent times.

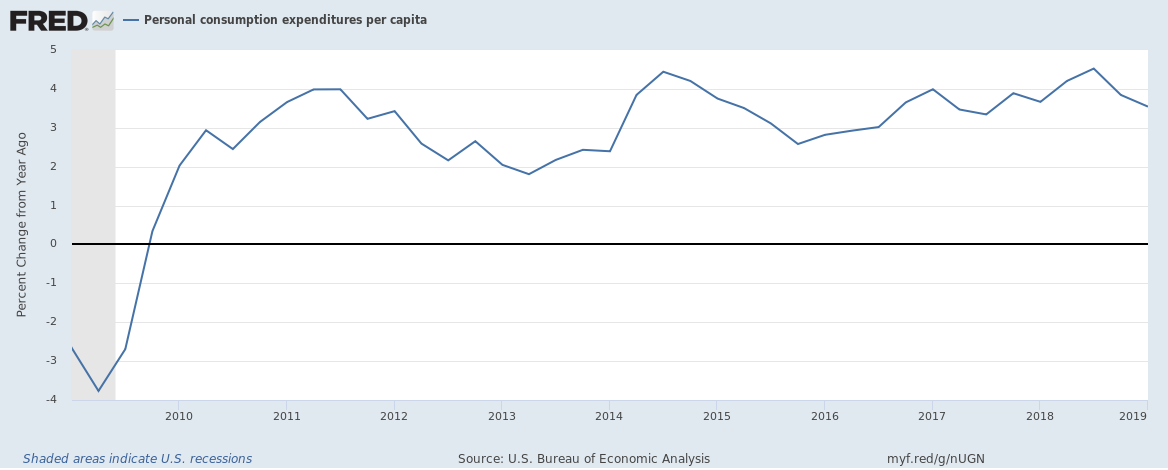
Personal consumption expenditures per capita
Finally, inflation may officially be only 2% but how much are people in the U.S. really spending? Personal consumption expenditures (which includes spending on goods and services – basically anything that is bought for personal consumption) per capita are up 3.5% which is much more than the rate of inflation.

Related:
The U.S. fiscal deficit hit $1.06 trillion in 2018 but is it really that bad?
U.S. corporate profitability accelerated in 2018 growing at 16% … or 8%