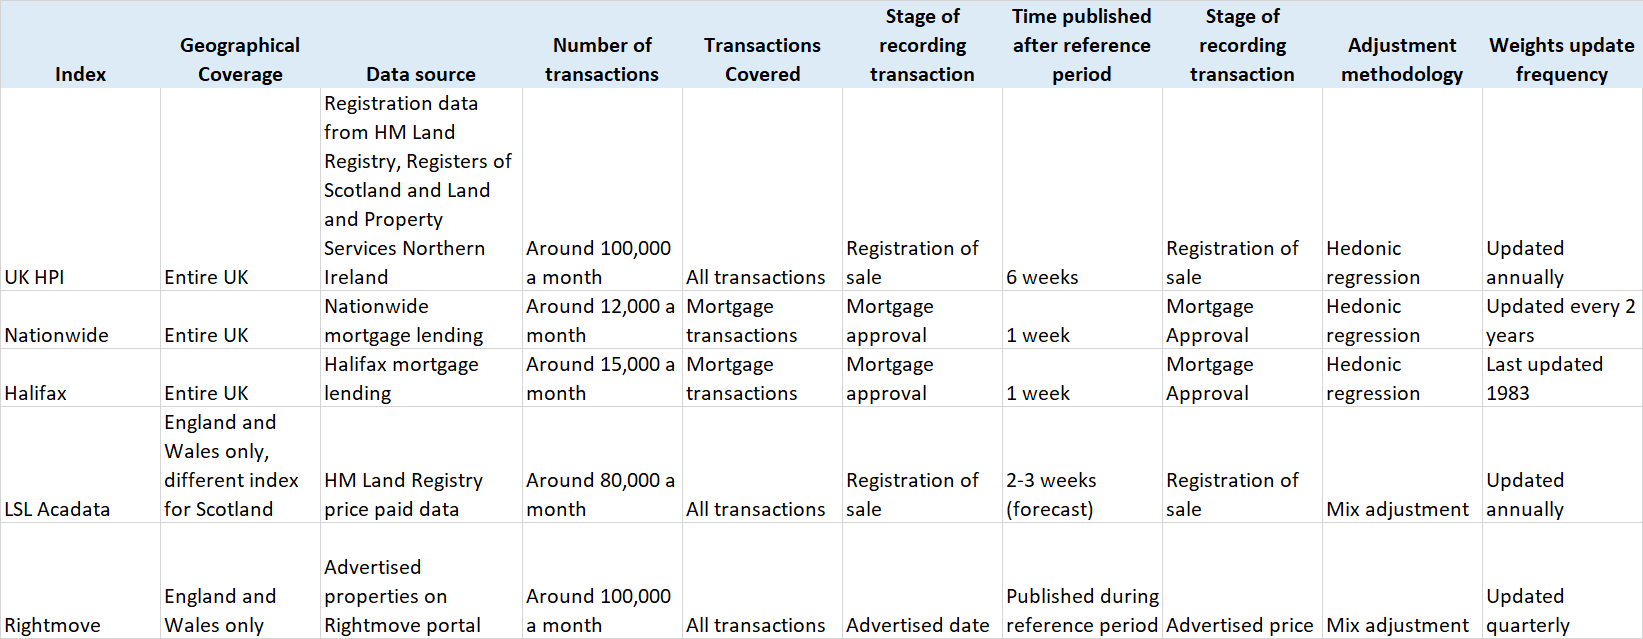
Comparison of house price indices (Halifax, Nationwide, Rightmove, UK House Price Index and LSL) in the UK

We asked the question, Are the British obsessed about house buying and house prices? a couple of months ago.

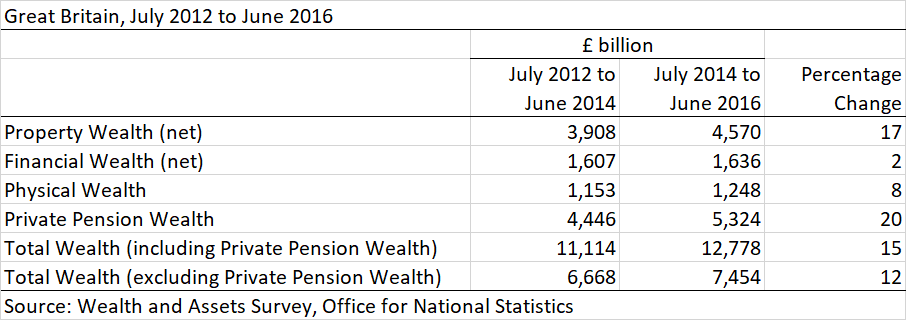
The British are obsessed about house prices because most of their wealth outside of pensions is invested in property.

UK household wealth by asset type
Source: Office for National Statistics

Here is a summarized comparison of the different house price indices in the United Kingdom,

Continue reading “Comparison of house price indices (Halifax, Nationwide, Rightmove, UK House Price Index and LSL) in the UK”

Can the UK Government afford higher interest rates or rising bond yields?

We recently wrote about the impact of rising interest rates for UK households, read more about it here. We also wrote about the impact of higher bond yields for the US government, read more about it here.

Impact of higher interest rates for the UK Government

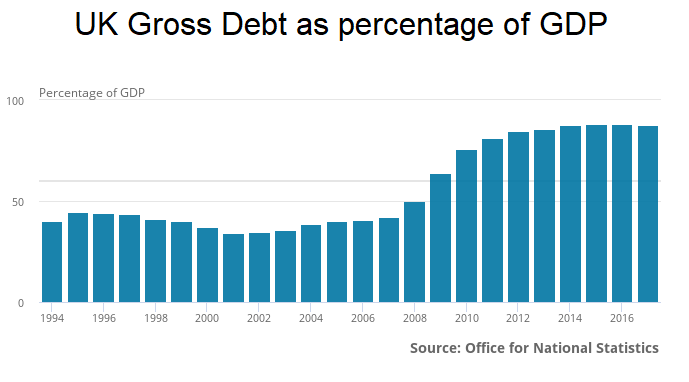
The UK government has around £1.72 trillion in debt and pays around £36 billion in interest payments a year (an effective interest rate of 2%).

The UK tax revenues are around £800 billion a year, which would mean 4.5% of all tax revenues are paid as interest. The UK has paid £540 billion in interest since it last ran a surplus in 2001.

Continue reading “Can the UK Government afford higher interest rates or rising bond yields?”

US and emerging market bond yields soar; UK retail; US Student debt; German GDP

US and emerging market bond yields

The US 10-year bond yield soared to 3.09% today (up 75 bps over the past year and 25 bps over the past month), the highest since 2011. The 2-year yield hit 2.59%, the highest since August 2008 (read more here on the financial impact of rising yields for the US Government).

The bigger story is of emerging markets though. Brazilian and Indian 10-year yields have soared 33 bps in just a week. The Brazilian 10-year bond yield topped 10.12% while the Indian 10-year bond yield topped 7.91%. The US dollar has gained 7% against the Brazilian Real and 4% against the Indian Rupee over the past month.

Canadian bond yields are soaring the most amongst developed nations with the 10-year yield hitting 2.51%, up 94 bps over the past year and 24 bps over the past month. Continue reading “US and emerging market bond yields soar; UK retail; US Student debt; German GDP”
Weekly Overview: The Baltic Dry Index is up 48% over the past month; Argentina seeks IMF bailout; UK House Prices; Brazil 10-year bond tops 10%; Coal prices soaring

Baltic Dry Index

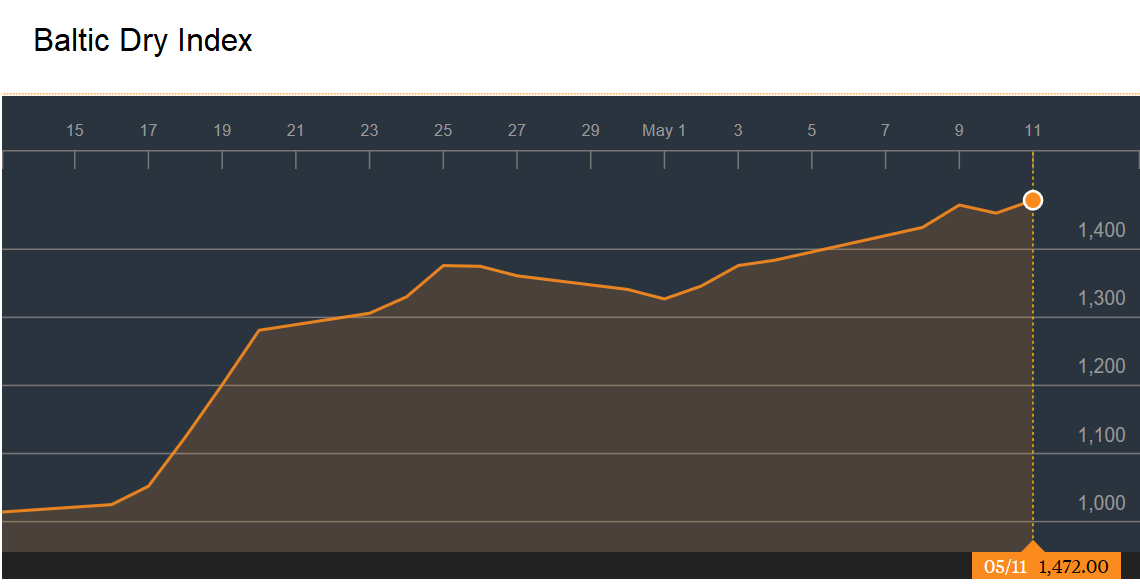
The Baltic Dry Index is a trade indicator that measures shipping prices of major raw materials and is often seen as a global growth indicator.

Over the past month, it has zoomed 48%. It is up 45% over the past year and is up 8% since the start of the year. This despite weaker US, UK and France Q1 2018 GDP growth. The Baltic Dry index generally falls in the first quarter on back of lower trading activity due to the Chinese New Year but this time it hadn’t recovered until very recently.

Here is a chart of the index over the past month,

Continue reading “Weekly Overview: The Baltic Dry Index is up 48% over the past month; Argentina seeks IMF bailout; UK House Prices; Brazil 10-year bond tops 10%; Coal prices soaring”

Highlights from April 2018

Here are highlights from April 2018,

Our three most read posts in April 2018

1. Alphabet (the parent company of Google) spent the most as a company on lobbying. Facebook’s spend on lobbying increased 5500% since 2009. They spent most lobbying on changes to … data privacy (Click here to read).

2. This is what has happened to the unemployment rate in the US four to eight months before every recession since the 1940s and why it matters now (Click here to read).

3. Not an April Fools’ Day joke – this really is how the US Dollar has performed against each currency of the world over the past one year (Click here to read). Continue reading “Highlights from April 2018”

Household saving rates are falling globally

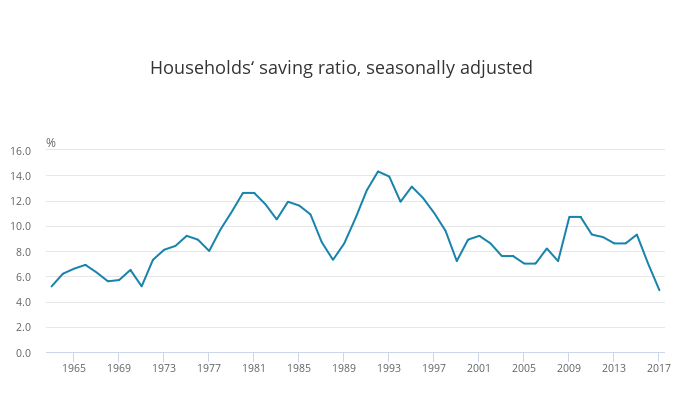
We recently wrote about the UK household savings ratio falling to a record low of 4.9% in 2017 (since comparable records began in 1963) as growth in households’ spending exceeded the growth of households’ income. (Read more here).

Households saving ratio, seasonally adjusted
UK Household Saving Rate, Source: Office for National Statistics

We also wrote about the household savings rate in the US falling to a multi-year low of 3.1% as household expenditure grew quicker than income (Read more here). Continue reading “Household saving rates are falling globally”

UK households’ saving ratio falls to the lowest ever on record as mortgage and consumer credit outstanding hits the highest ever

The Office for National Statistics (ONS) and the Bank of England (BoE) both released UK data on March 29 and the data doesn’t look good. Key highlights include:

  • The households’ saving ratio fell to an annual record low of 4.9% in 2017 (since comparable records began in 1963) as growth in households’ spending exceeded the growth of households’ income.
  • Consumer Lending Outstanding (seasonally adjusted) excluding student loans hit a new record high £209.45 billion, higher than even before the financial crisis.
  • Total Mortgage Outstanding (seasonally adjusted) hit a new record high of £1.38 trillion.
  • Households accumulated slightly more debt in the form of loans in 2017 than they did financial assets for the first time since records began in 1987.

Continue reading “UK households’ saving ratio falls to the lowest ever on record as mortgage and consumer credit outstanding hits the highest ever”