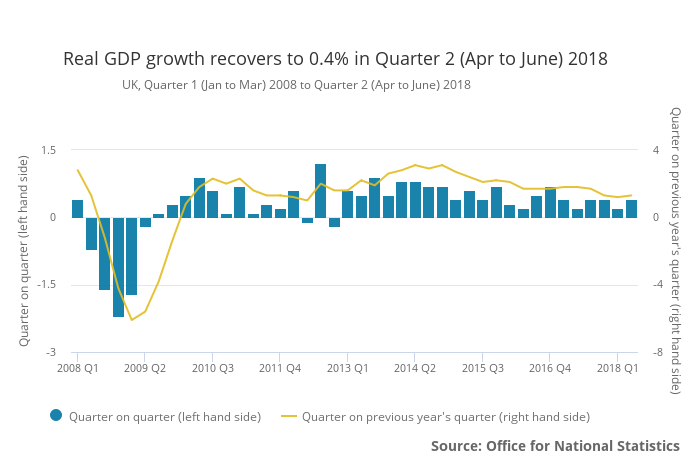
UK GDP in volume terms was estimated to have increased by 0.4% between Q1 2018 and Q2 2018. GDP rose by 1.3% in Q2 2018 compared with the same quarter a year ago.
Why wouldn’t it be?
UK GDP in volume terms was estimated to have increased by 0.4% between Q1 2018 and Q2 2018. GDP rose by 1.3% in Q2 2018 compared with the same quarter a year ago.
We will be publishing a number of statistics for the United Kingdom (and the European Union) over the next few days in the run up to a major piece we will be publishing on the real economics of Brexit.
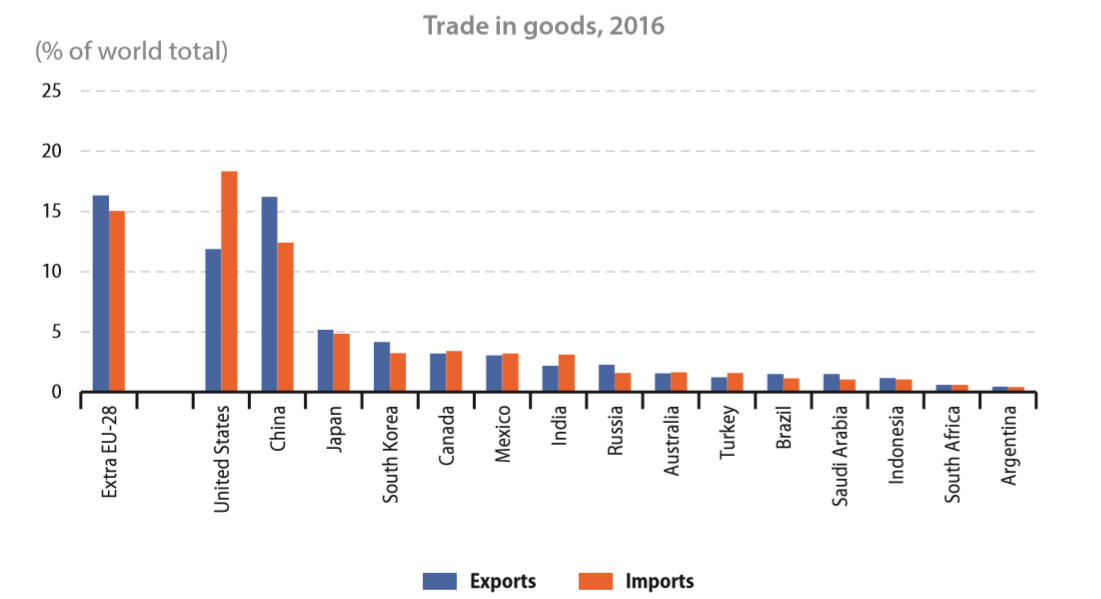
The European Union (EU28 or EU) accounted for around one sixth of world trade in goods in 2016, with a 16.3% share of exports and a 15.0% share of imports. Turning to services the EU28’s contribution to world trade (mainly due to the United Kingdom which is leaving the European Union) was even greater, totalling 24.7% of exports and 21.1% of imports.
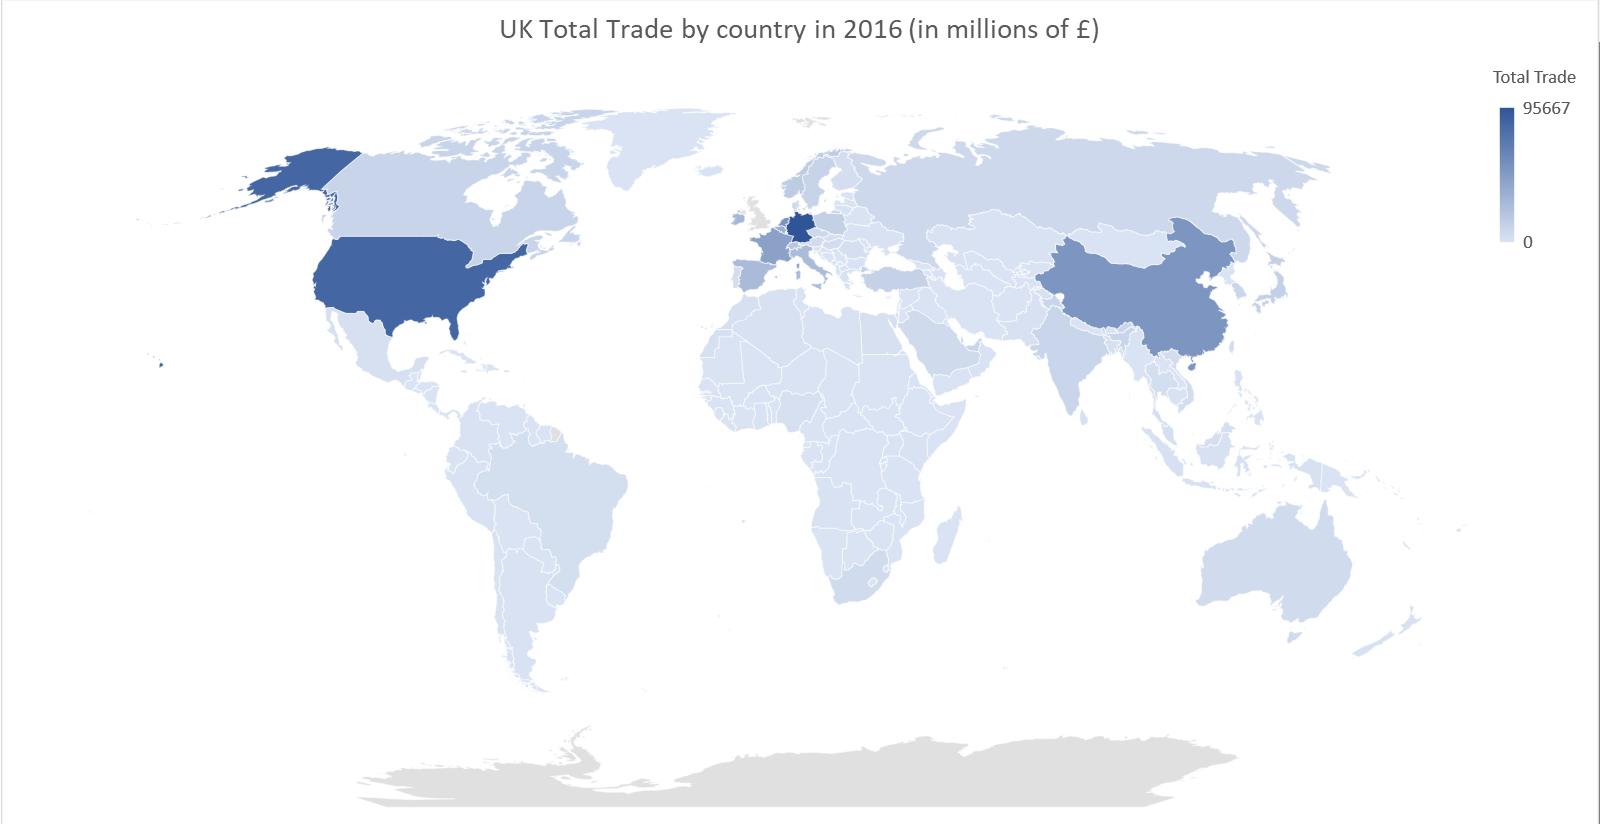
We will be publishing a number of statistics for the United Kingdom over the next few days in the run up to a major piece we will be publishing on the real economics of Brexit. In the meanwhile, here are trade statistics for the United Kingdom for 2016 (the latest full year of data available) sourced from the Office for National Statistics.
The top 5 countries for total trade value were Germany (£95.67 billion), the United States (£84.09 billion), the Netherlands (£53.93 billion), China (£52.51 billion) and France (£44.40 billion)
Continue reading “UK Trade Statistics for trade by each country”
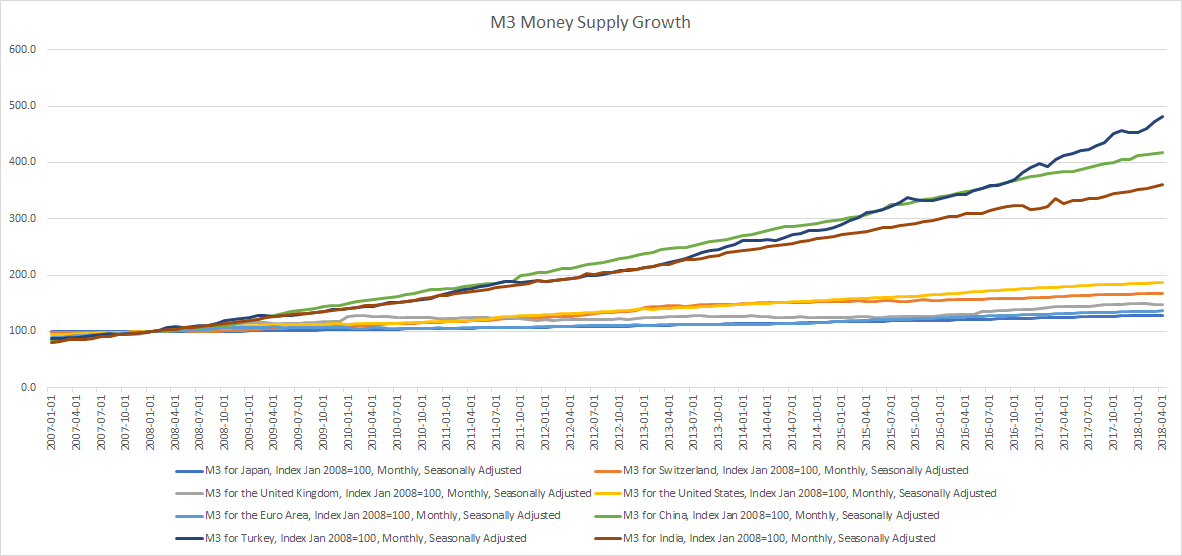
Broad Money M3
Broad money (M3) includes currency, deposits with an agreed maturity of up to two years, deposits redeemable at notice of up to three months and repurchase agreements, money market fund shares/units and debt securities up to two years.
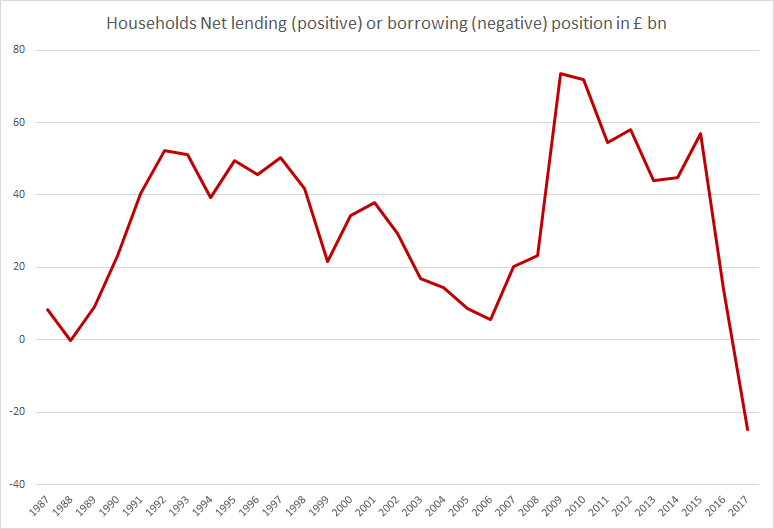
Households in the United Kingdom have seen their outgoings surpass their income for the first time in nearly 30 years as per a release from the Office for National Statistics.
On average, each UK household spent or invested around £900 more than they received in income in 2017. The total amounted to almost £25 billion for all households in the UK. Households’ outgoings last outstripped their income for a whole year in 1988, although the shortfall was much smaller at just £0.3 billion back then.
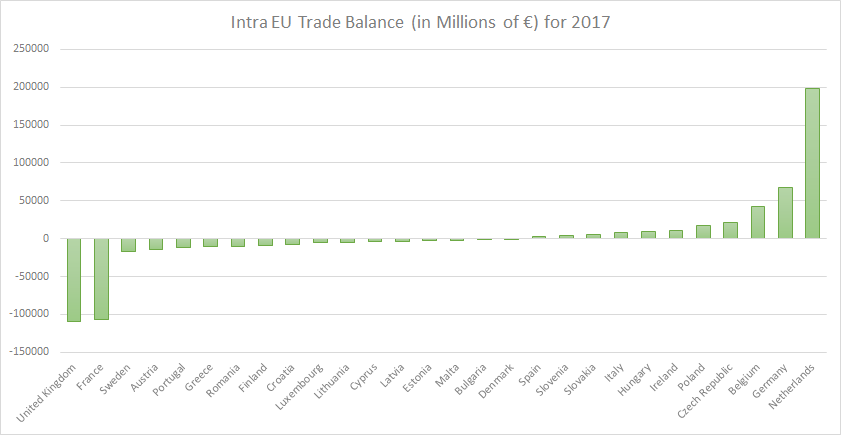
Some surprises in Intra European Union (EU) Trade Statistics for 2017: Germany was the largest exporter as expected but unexpectedly also the largest importer. The Netherlands (and not Germany) had the largest trade surplus. The United Kingdom had the largest trade deficit (no trade deal Brexit still on the table?)
Here is additional information, the complete dataset and maps,
With the UK government recently proposing extra spend for the National Health Service and potentially extra taxes to fund it, we look at how UK tax collections for different taxes have grown over time.
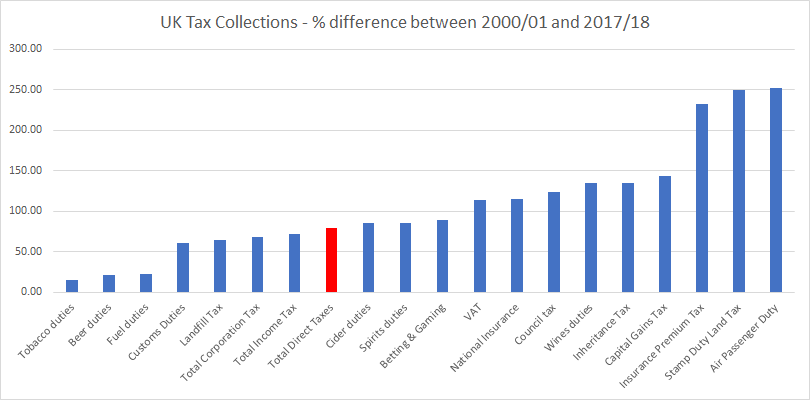
Continue reading “Here’s how UK tax collections for different taxes have grown since the year 2000”
Here are highlights from May 2018,
Our three most read posts in May 2018
2. Healthcare could soon be the largest expenditure of households in the U.S.
Several people in the UK didn’t experience the great (property price) crash of 2008. But several other people did. A decade on – do people remember? Here is a sample of prices from London’s financial district – Canary Wharf. And no, we haven’t taken the worst-case example, this is truly representative,

Continue reading “UK house sales and house price growth are slowing but is this time any different?”
Investors seek safety
What a difference a week makes, just last week everyone was talking about soaring bond yields. Investors are now seeking safety with developed economies bond yields falling significantly during the week.
Here are some 10-year bond yields, figures in brackets indicate change during the week.
US 2.93% (-15 bps)
UK 1.32% (-21 bps)
Germany 0.41% (-17 bps)
Canada 2.35% (-14 bps)
Switzerland 0.00% (-13 bps)
Netherlands 0.59%% (-15 bps)
Australia 2.79% (-13 bps) Continue reading “Weekly Overview: Investors seek safety as bond yields fall; Crude Oil down 5%; Baltic Dry Index down 15%; Bank of England Governor prepared to cut or freeze interest rates; US E-Commerce Retail sales soaring”