Real gross domestic product for the United States increased at an annual rate of 4.1% in Q2 2018 according to the advance estimate released by the Bureau of Economic Analysis.
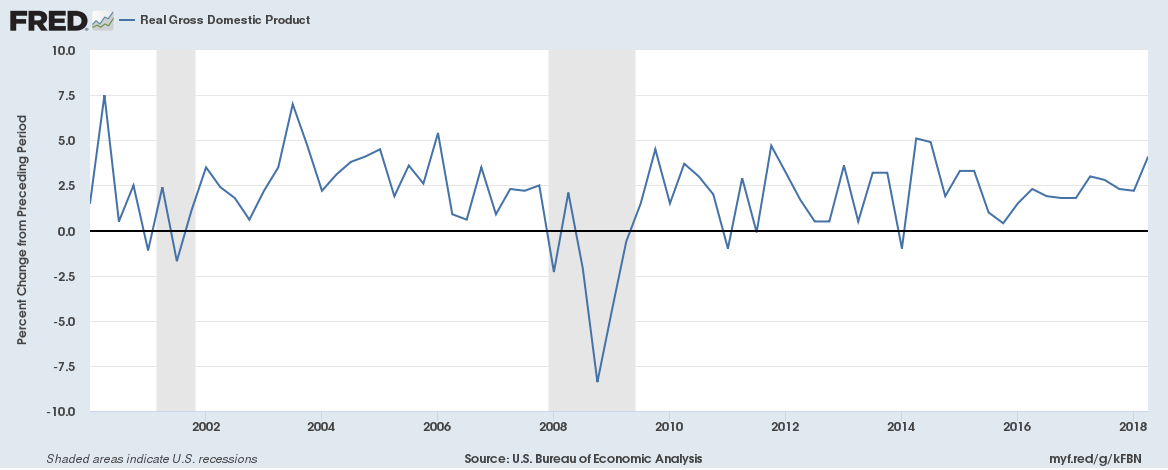
Why wouldn’t it be?
Real gross domestic product for the United States increased at an annual rate of 4.1% in Q2 2018 according to the advance estimate released by the Bureau of Economic Analysis.
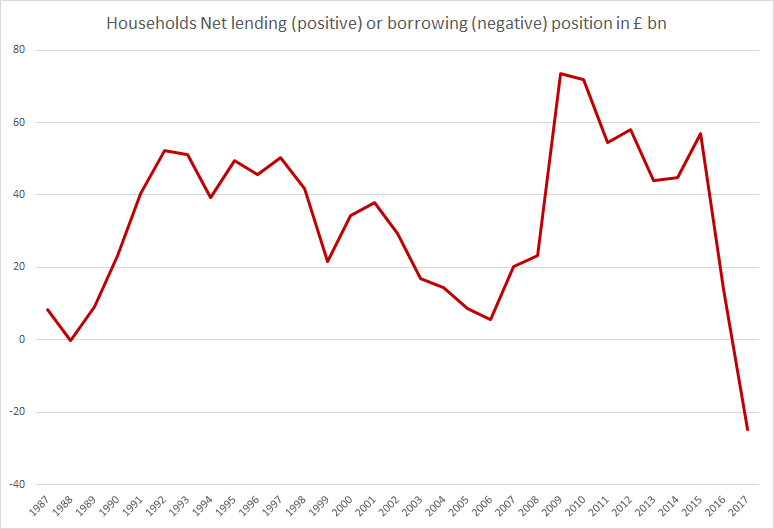
Households in the United Kingdom have seen their outgoings surpass their income for the first time in nearly 30 years as per a release from the Office for National Statistics.
On average, each UK household spent or invested around £900 more than they received in income in 2017. The total amounted to almost £25 billion for all households in the UK. Households’ outgoings last outstripped their income for a whole year in 1988, although the shortfall was much smaller at just £0.3 billion back then.
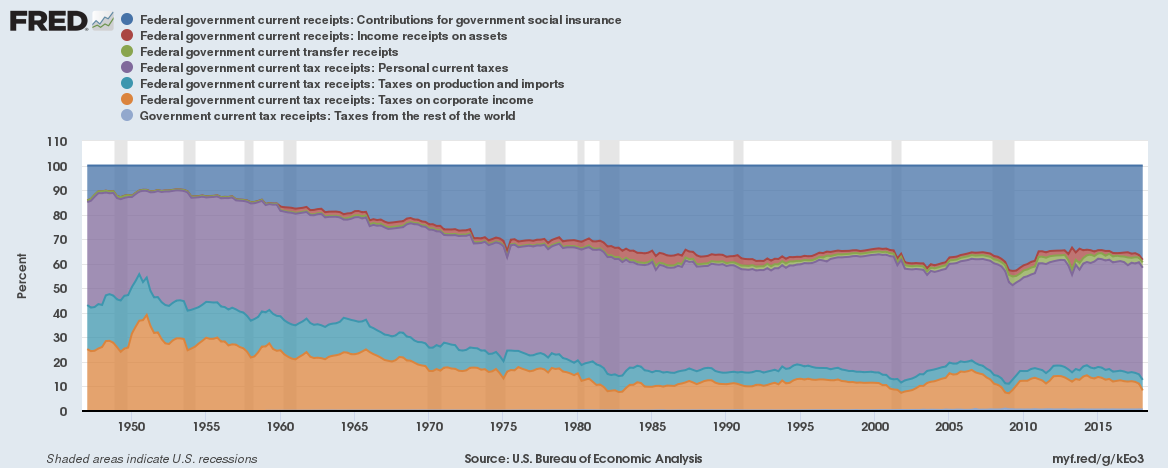
Personal taxes now contribute a multi-year record 45.7% of total Federal government receipts.
The United States government is likely to run a record fiscal deficit this year due to lower tax receipts. And given deficits since 2001, Federal debt is soaring (chart below). In the immediate aftermath of the last recession, the Federal Reserve was a major buyer of U.S. Treasury bonds.
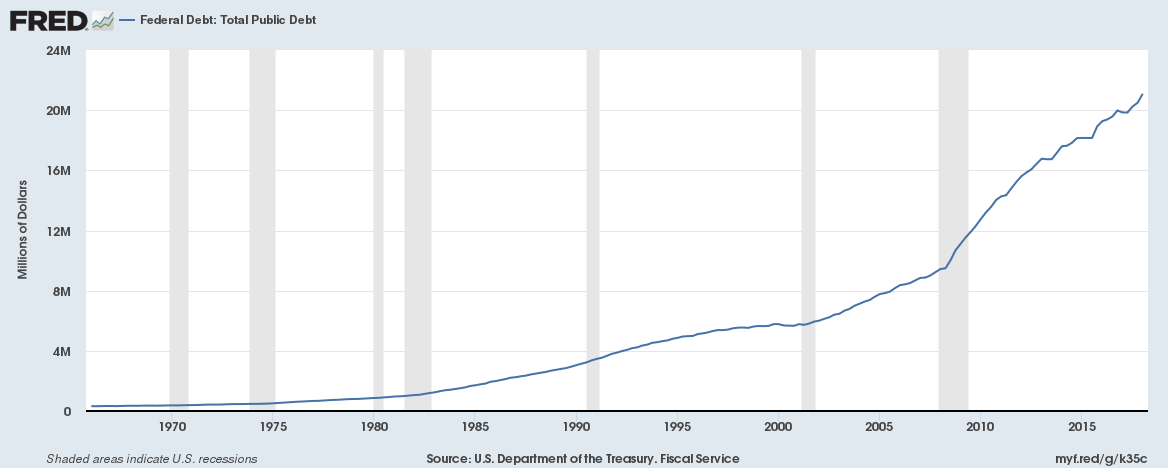
Since 2014 though, the Fed isn’t really a buyer of Treasury bonds. The question is who is buying federal government debt?
We recently posted about population percentage for each country by age. The data was for 2016 from the World Bank and is the latest set of available data. We also wrote about the business of aging – how changing demographics are shaping the economic future in more ways than one. Here we explore if the youth economic dividend that many economists point to exists in the current world order.
Here is a map of population percentage for age below 15:
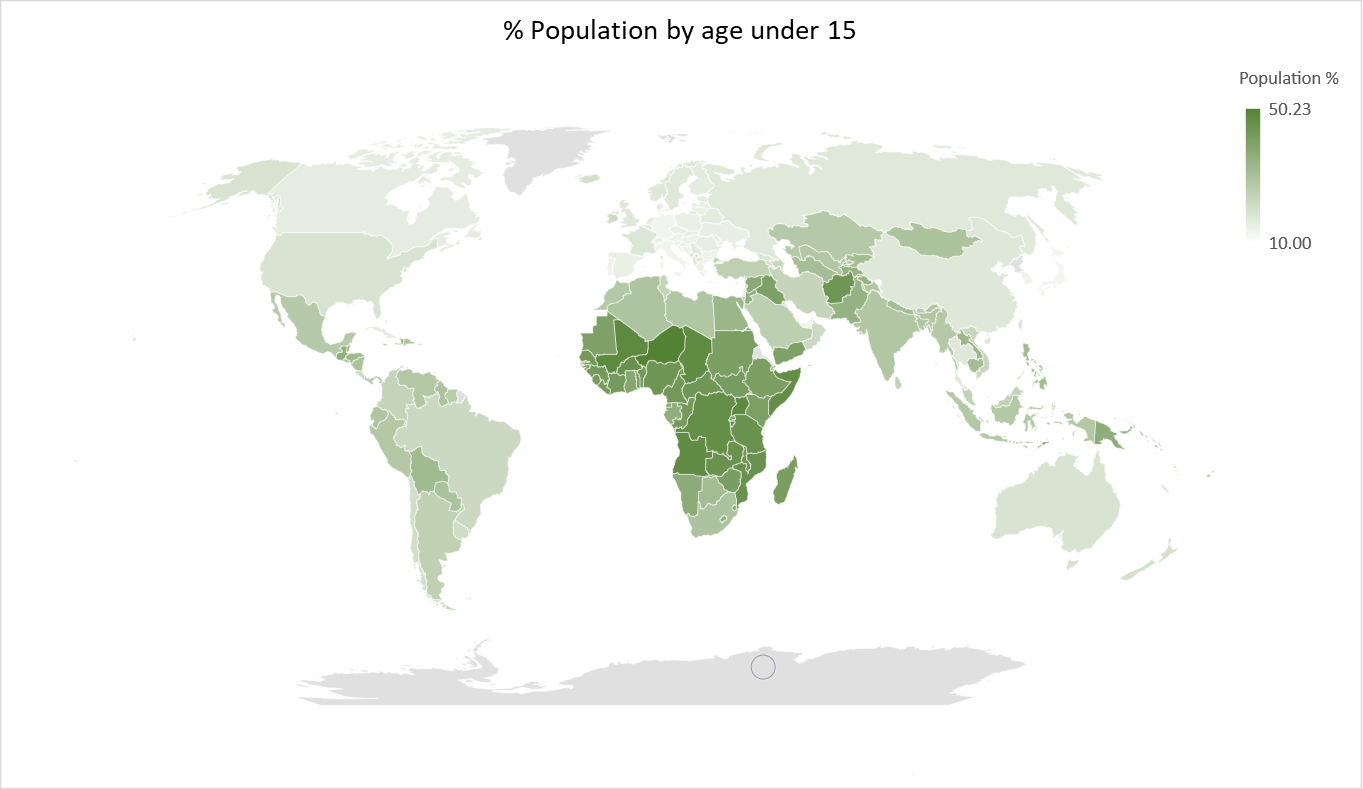
Continue reading “The youth economic dividend – does it really exist for the current day world?”
The home vacancy rate is the proportion of the homeowner inventory that is vacant for sale.
The rental vacancy rate is the proportion of the rental inventory that is vacant for rent.
Here are the home and rental vacancy rates for each state of the United States (Data Source: U.S. Bureau of the Census),
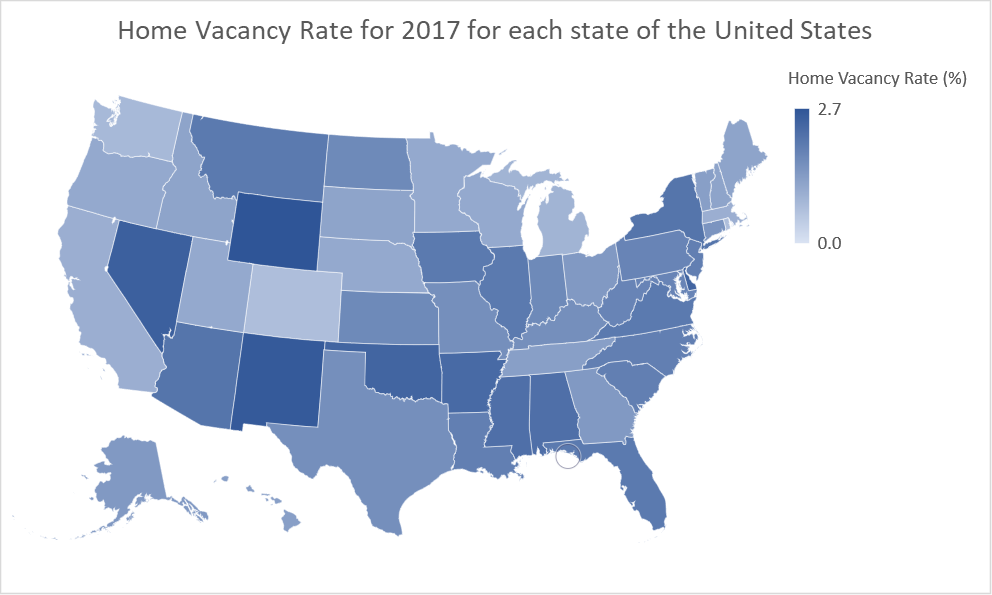
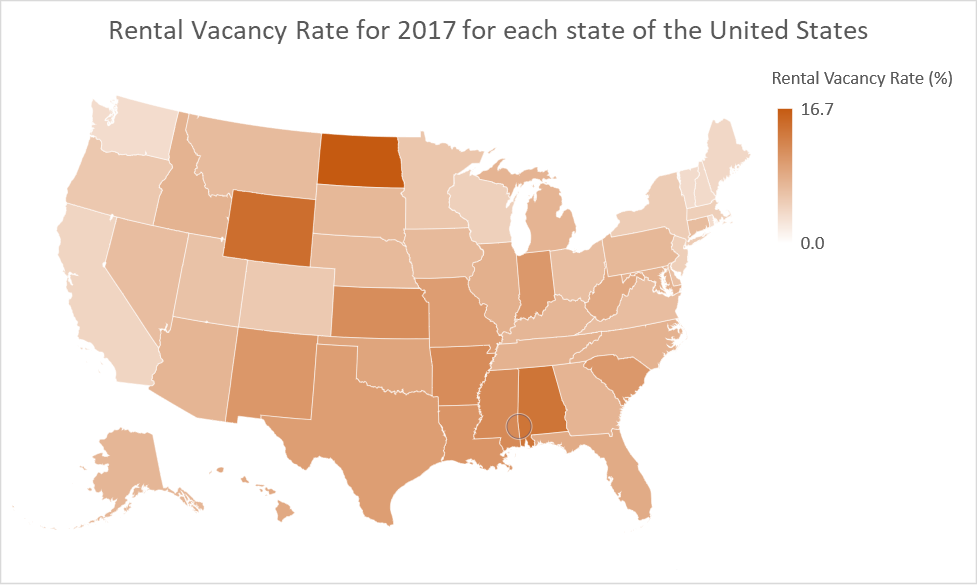
Continue reading “Home and Rental Vacancy Rate for each state of the United States”
We recently posted about population percentage for each country by age. The data was for 2016 from the World Bank and is the latest set of available data. Here is a map of population percentage for age 65 and above:
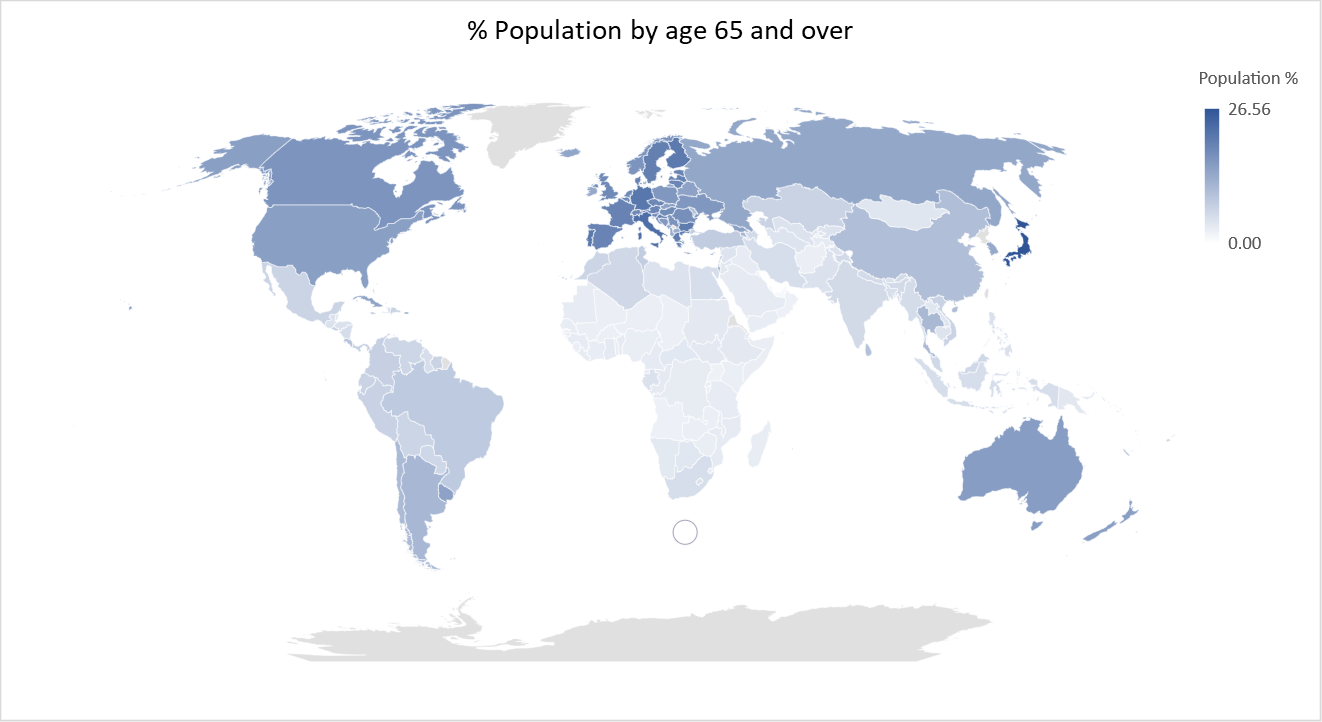
And here is a map of interest rates for each country as of June 8, 2018:
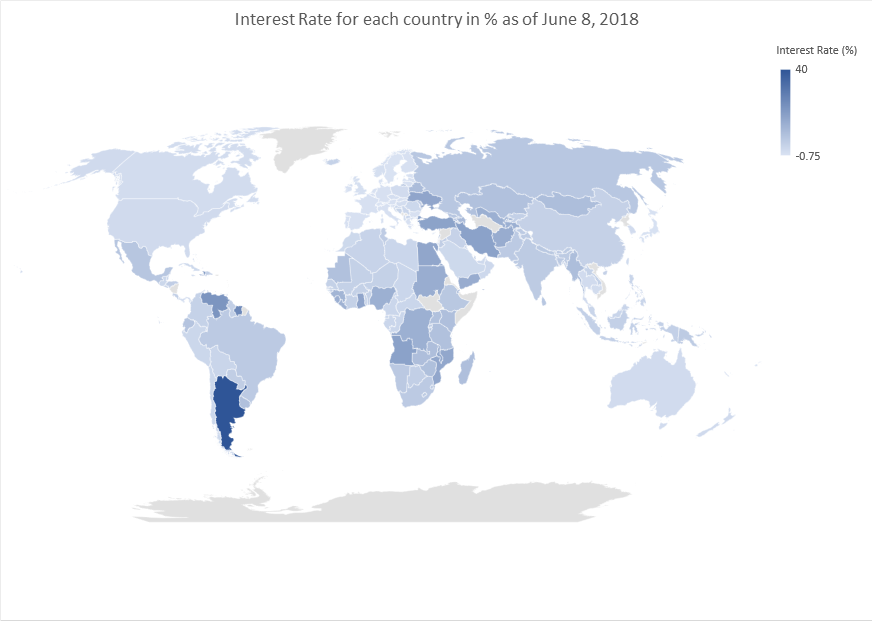
See some correlation – direct or inverse?

Temperature records worldwide are being broken shattered by the ongoing global heatwave.
Continue reading “The global economy is scorching hot right now (just like the weather) but … Winter is Coming”
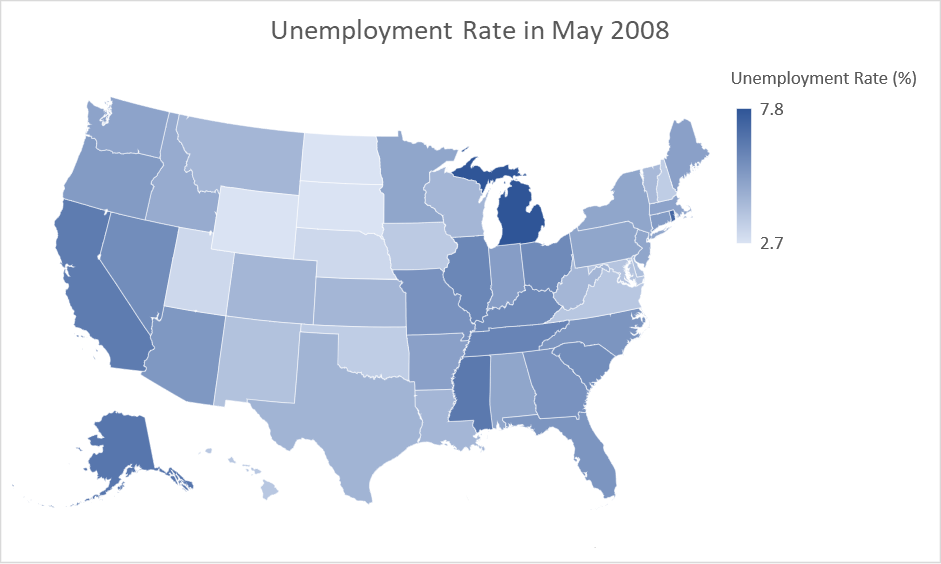
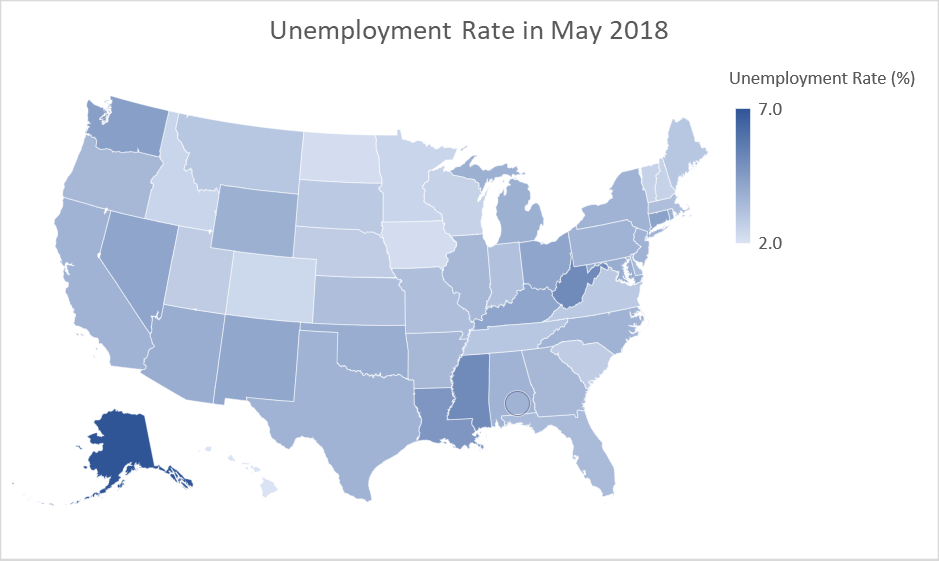
Some states in the United States have done exceptionally well over the past decade creating massive number of new jobs and reporting record low unemployment. There are reports of major labour shortages in at least some states currently.
Here are maps of the unemployment rate in each state in May 2008 and May 2018,
The business of aging or the youth economic dividend? Or both? Well, we have written up something on both but in the meanwhile here’s the percentage population for each country (Data Source: World Bank) by three age groups – Under 15, 15 to 64 and 65 and over.
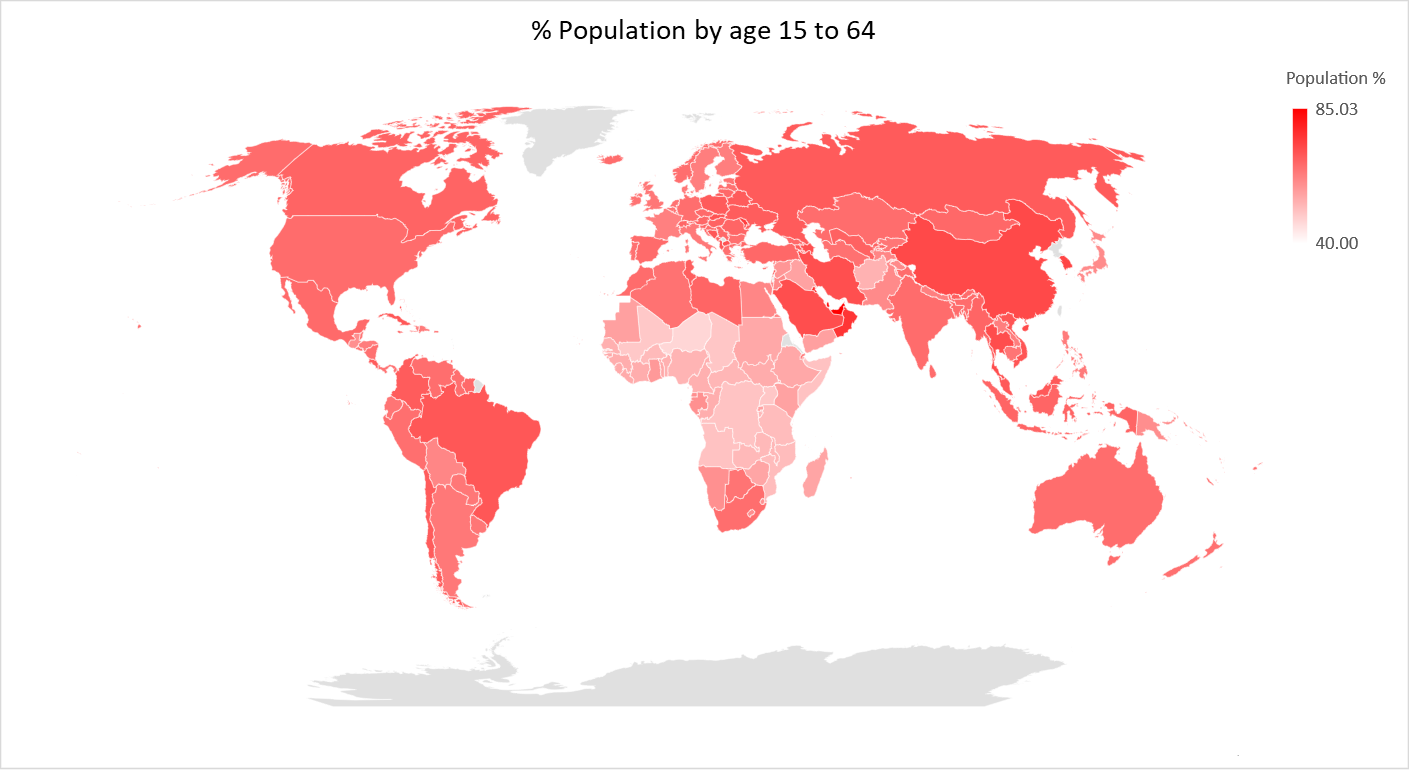
Continue reading “Percentage population for each country by age”