Here’s how the unemployment rate has changed for every state in the United States over the past decade

Some states in the United States have done exceptionally well over the past decade creating massive number of new jobs and reporting record low unemployment. There are reports of major labour shortages in at least some states currently.

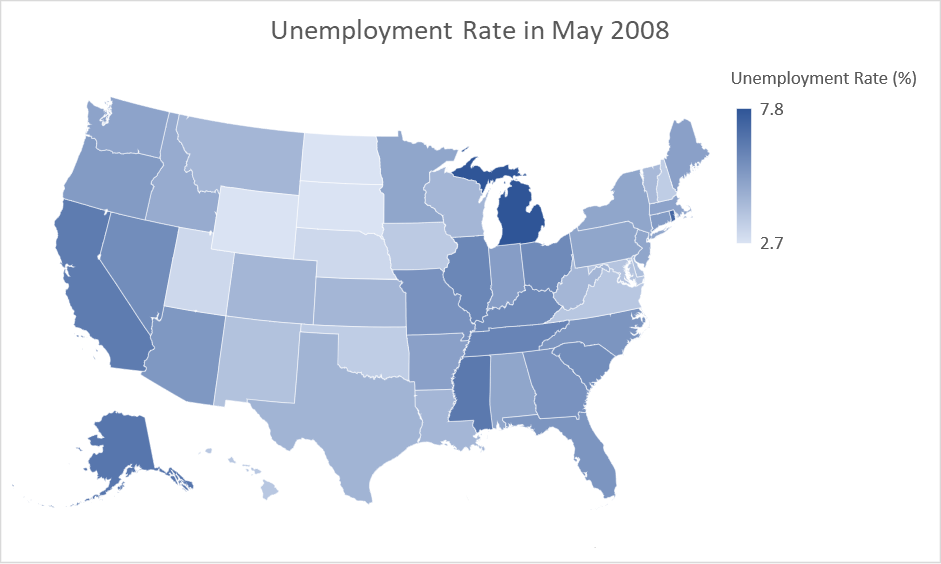
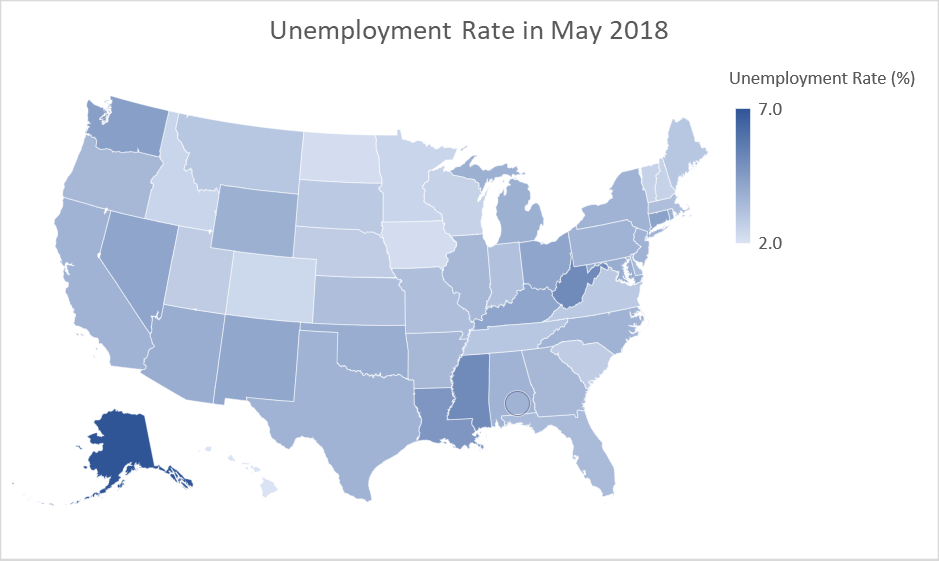
Here are maps of the unemployment rate in each state in May 2008 and May 2018,

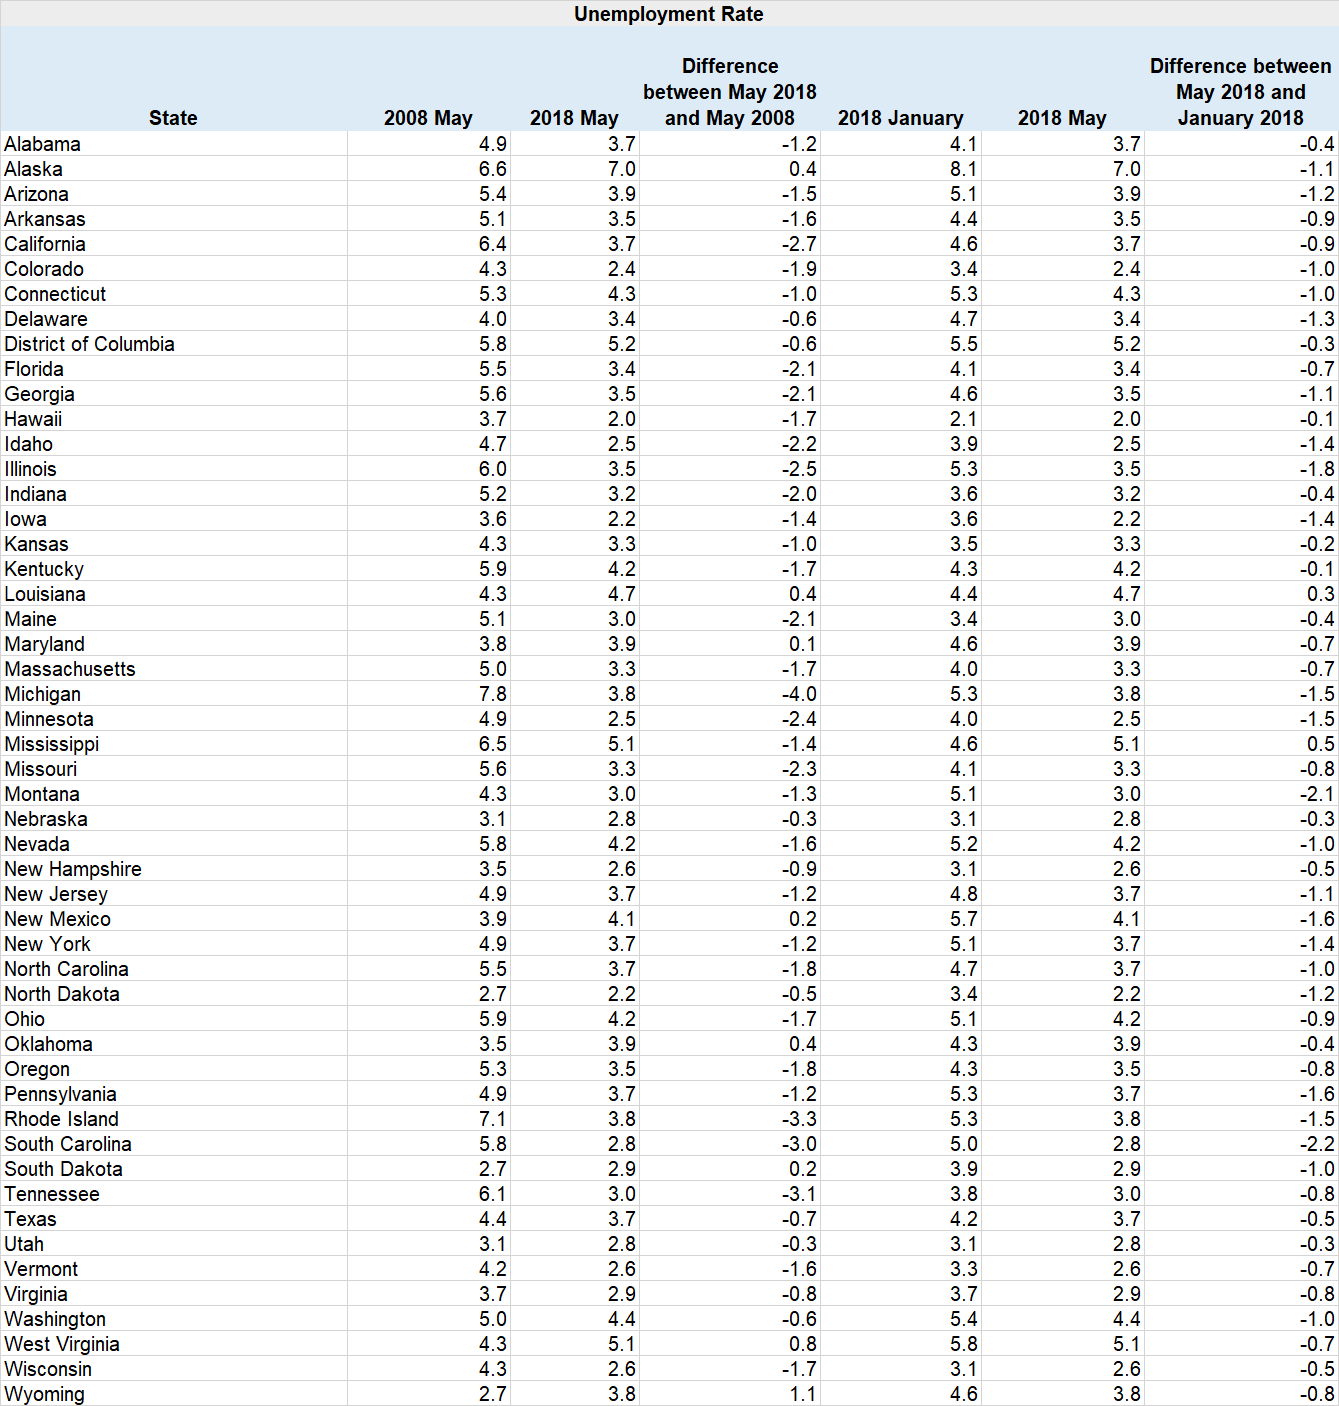
And here is the data set,

Related: The U.S. unemployment rate is at an 18-year low but only because the labour force participation rate is close to a 40-year low.

Leave a Reply

Your email address will not be published. Required fields are marked *

This site uses Akismet to reduce spam. Learn how your comment data is processed.