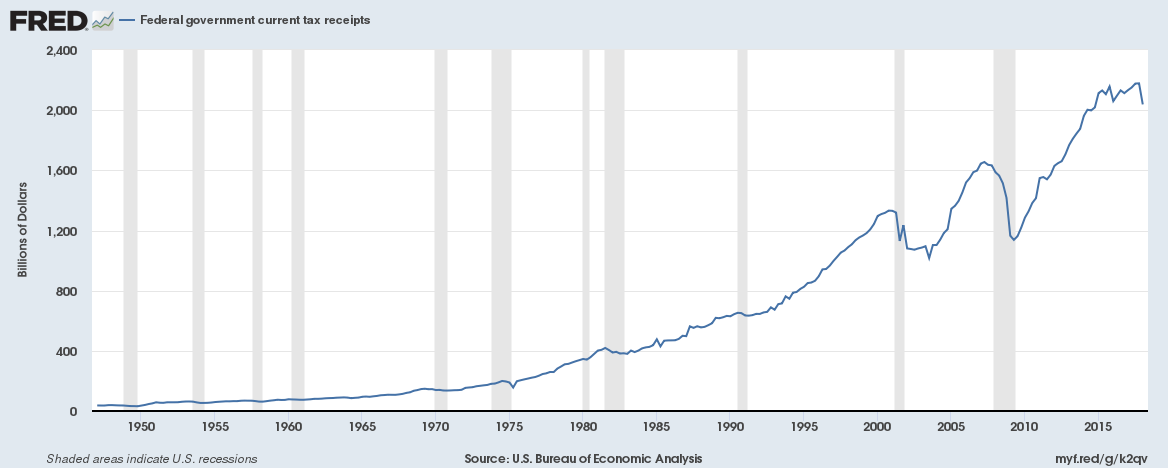
1. Total tax receipts are down 5% year on year (Q1 2018 vs Q1 2017)
Total tax receipts are down 5% year on year from $2.14 trillion in Q1 2017 to $2.04 trillion in Q1 2018.
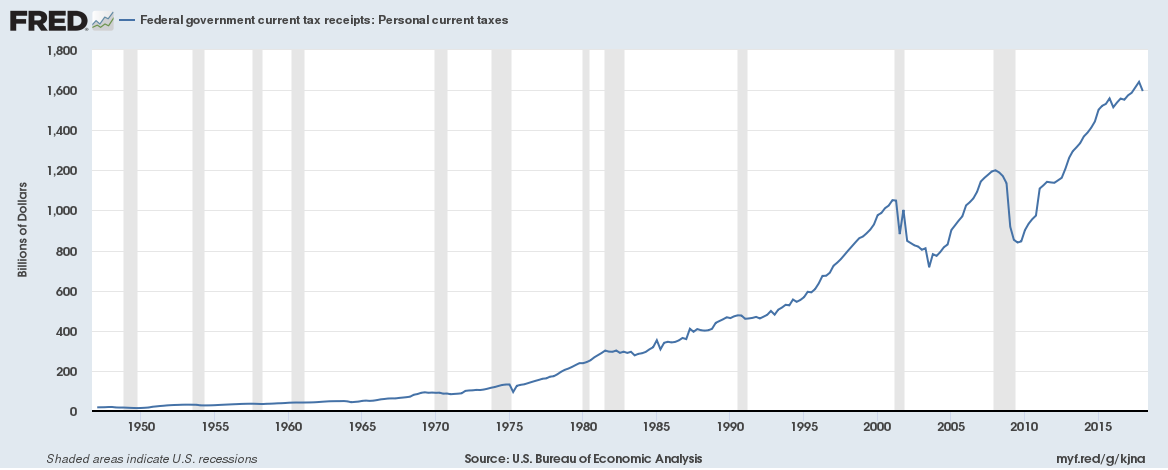
2. Personal tax receipts are up just 1.35% year on year (Q1 2018 vs Q1 2017)
Total personal receipts are up just 1.35% from $1.57 trillion in Q1 2017 to $1.59 trillion in Q1 2018.
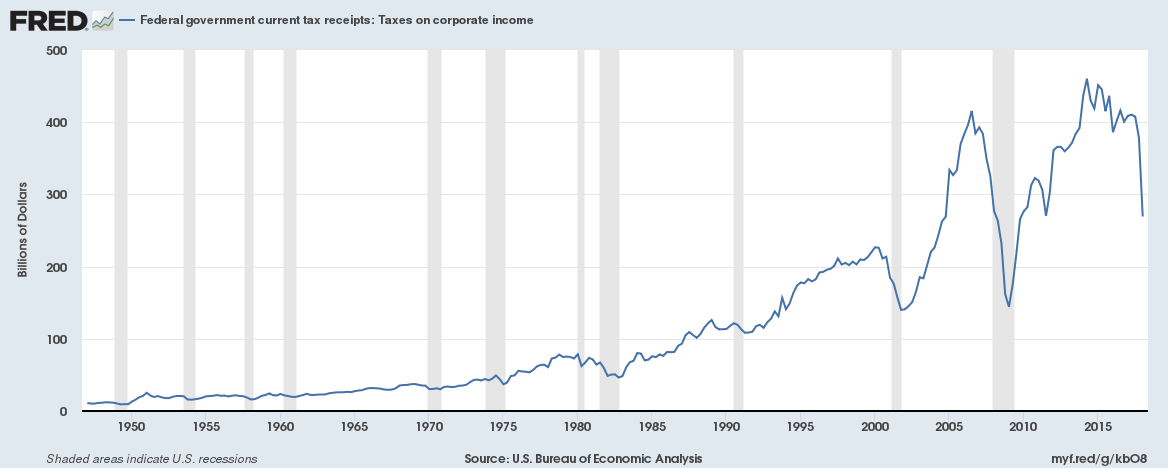
3. Corporate tax receipts are down 34% year on year (Q1 2018 vs Q1 2017)
Corporate tax profits are down 34% from $408.85 billion in Q1 2017 to $269.26 billion in Q1 2018.
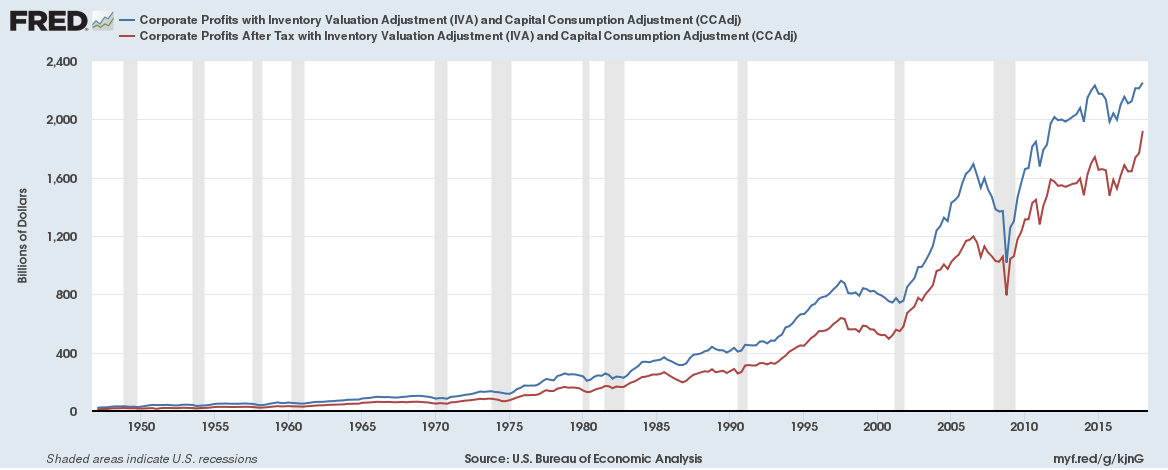
4. … but Corporations in the U.S. have never been more profitable
Corporate Profits with Inventory Valuation Adjustment (IVA) and Capital Consumption Adjustment in Q1 2018 were at an annualized $2.25 trillion, up from an annualized $2.11 trillion. The post tax numbers look even better.
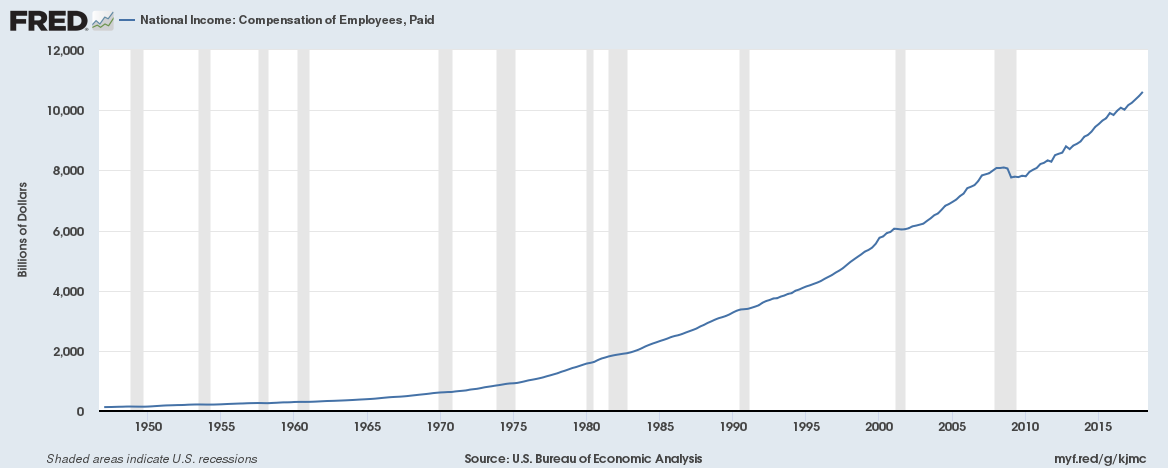
5. … and there is no real “tax cut” pay rise for employees
We have crunched the numbers, total employee compensation (including bonuses) divided by total number of employees is up 2.7% year on year. And the official inflation rate is also 2.7% (urban CPI), there is no real “tax cut” pay rise for employees.
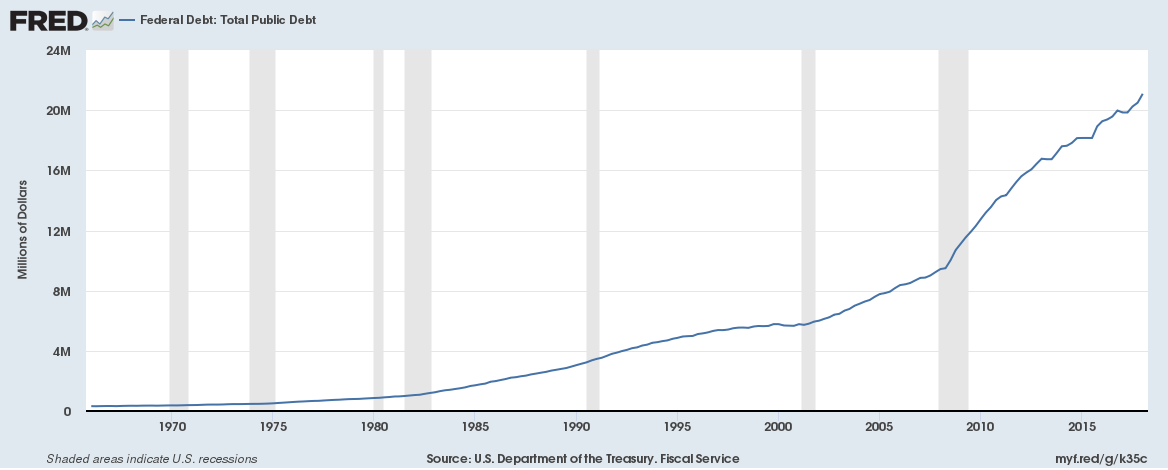
6. Federal debt is over $21 trillion
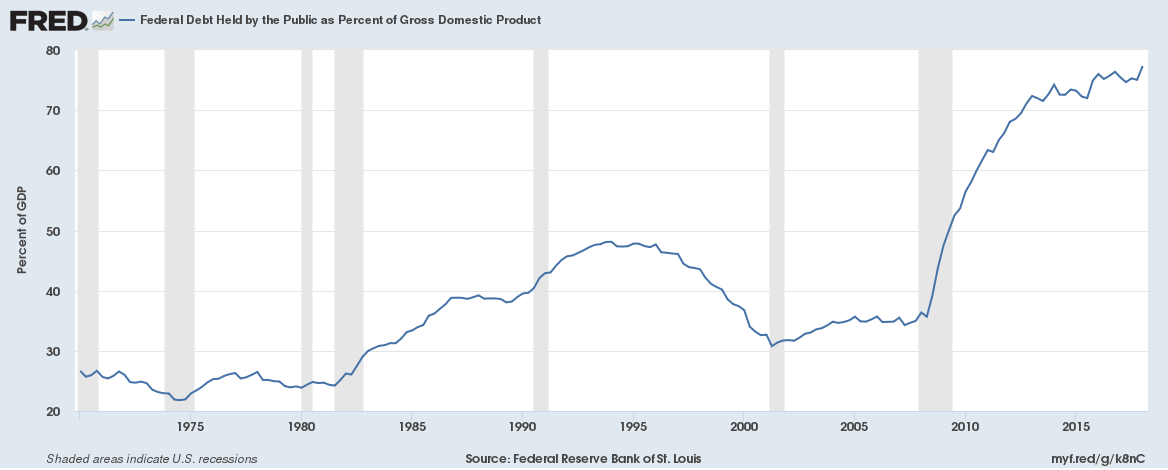
7. … and as a percentage of GDP is at a record high
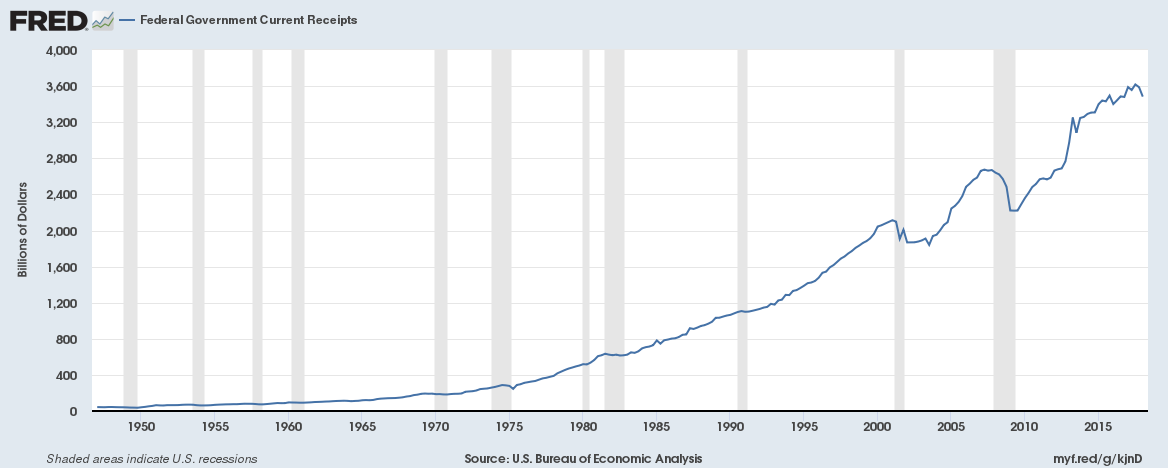
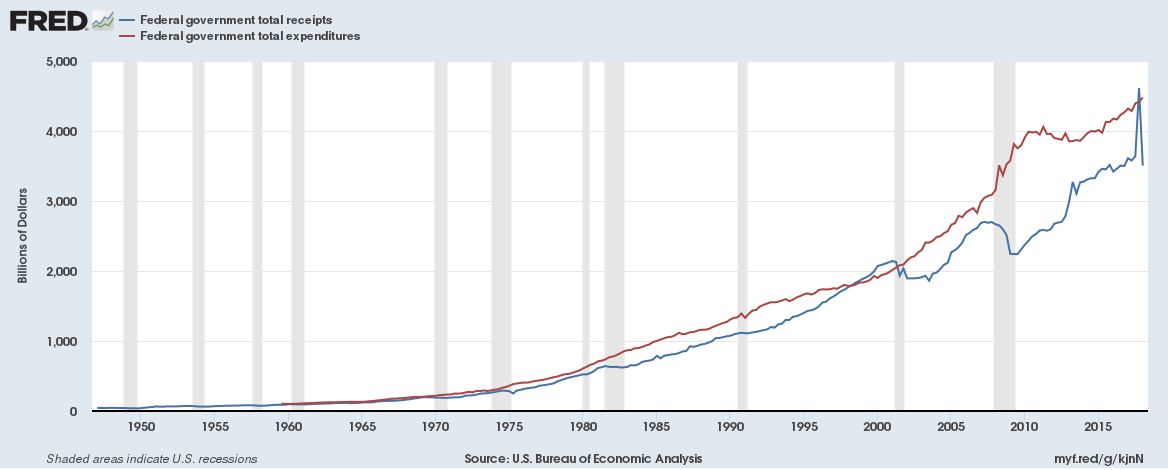
8. … while total federal receipts (not just tax) are falling too
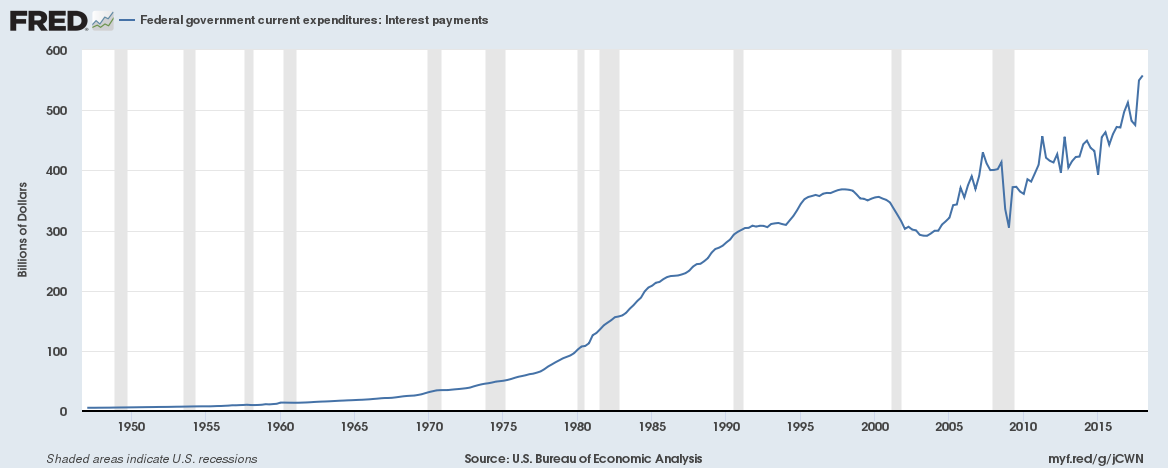
9. … and Federal interest payments are rising
10. Unsurprisingly, Federal expenditure is rising far quicker than federal receipts
11. … in an environment of rising interest rates and rising bond yields
Can the US government really cope with rising bond yields?
Those words … this time it is different.