The U.S. economy is doing great and is set to contribute 25% of global Gross Domestic Product (GDP) this year, its highest share since 2007. The rise of the U.S. dollar and increases in interest rates are squeezing emerging economics at an unprecedent pace. But it isn’t just emerging economies that are feeling the squeeze, Europe has its problems with Italian debt (and yields), the Australian dollar which has long been considered a growth asset has been falling this year and elsewhere trade worries and rising oil prices are having a big impact on other nations. Even German factory orders are the weakest in years as the U.S. is truly taking back economic leadership.
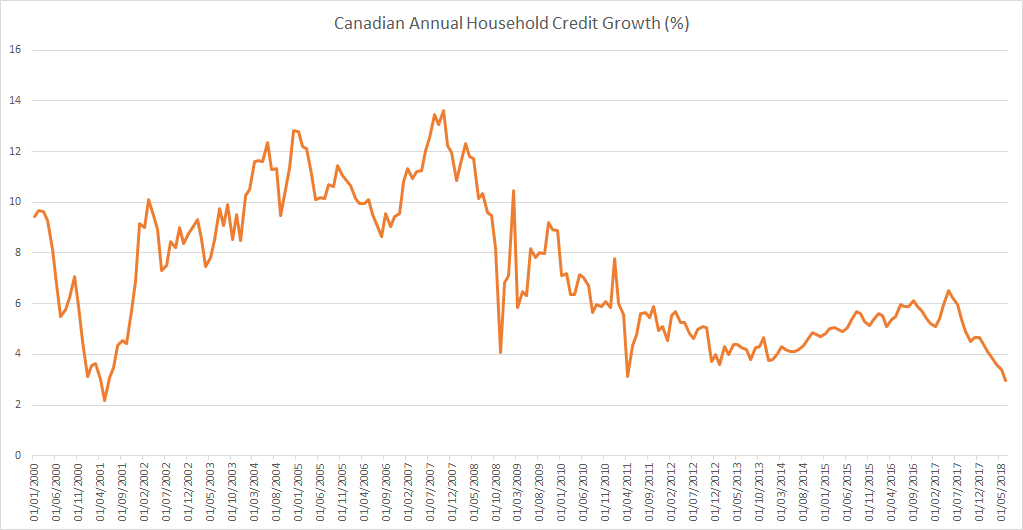
Canadian household credit growth is slowest since 2001 but individual debt is already 175 percent of disposable income
Canadian household credit growth is slowest since 2001 with Household credit (Annualized 3-month growth rate) growing at 2.98% and Household Mortgage credit (Annualized 3-month growth rate) growing at 2.85%.
Past, present, future – some demographic and economic statistics for the European Union
We will be publishing a number of statistics for the United Kingdom (and the European Union) over the next few days in the run up to a major piece we will be publishing on the real economics of Brexit.
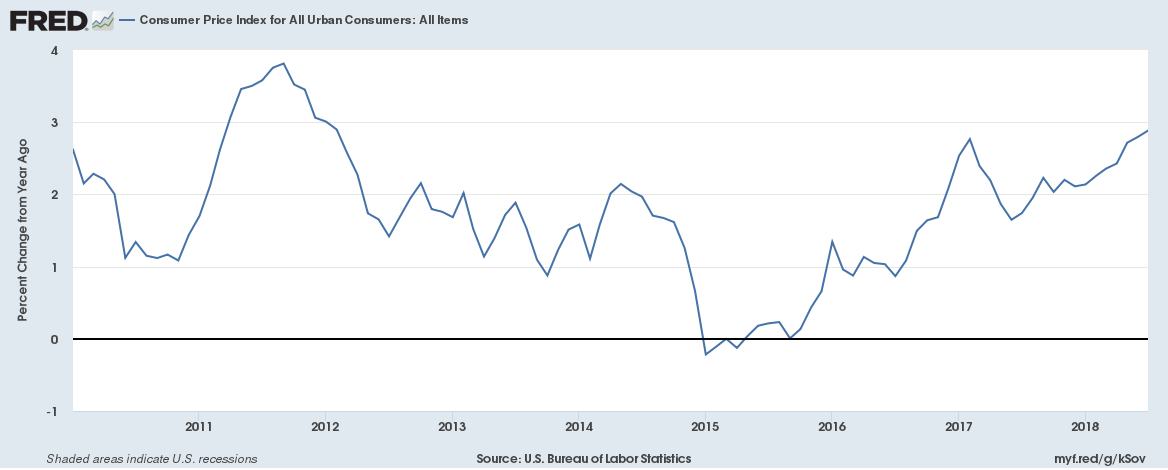
U.S. Inflation at 2.9% is the highest since February 2012 and has outstripped wage growth for the first time since October 2012
U.S. Consumer Inflation at 2.9% is the highest since February 2012. And it isn’t just energy prices causing inflation to soar. Core inflation (which is Consumer inflation excluding volatile energy and food prices) at 2.4% has risen at the fastest pace in a decade. Here is a chart for CPI inflation growth,
History is repeating itself, is this the end of the current cycle of global synchronised growth?
We wrote earlier this year on the downsides of synchronised global growth. We wrote that when global synchronised growth begins to end the U.S. dollar strengthens, investors run away from emerging markets, interest rates continue to rise to tame inflation and bad debt becomes an issue. All of this is happening now, first the US Dollar, here is the 1-year performance of the U.S. Dollar mapped,
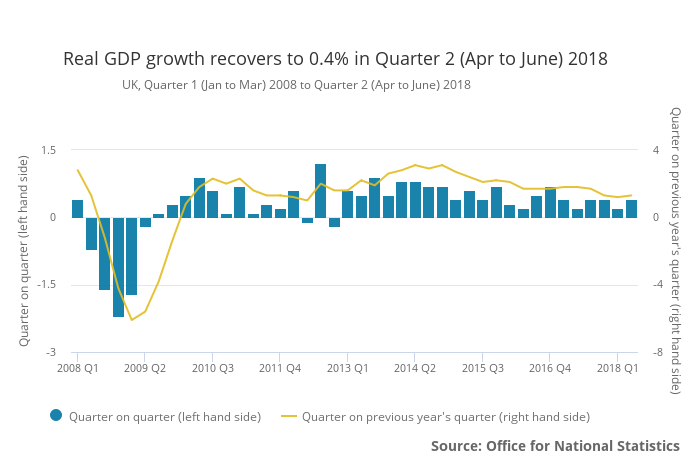
UK Q2 2018 GDP increased by 0.4% (growing faster than the Eurozone) as widening trade deficit drags growth
UK GDP in volume terms was estimated to have increased by 0.4% between Q1 2018 and Q2 2018. GDP rose by 1.3% in Q2 2018 compared with the same quarter a year ago.
Euro Area or Eurozone Money Velocity seems to be shockingly low
We couldn’t find any official Money Velocity numbers for the Euro Area (Eurozone) so calculated it using the Equation of Exchange
Equation of Exchange
MV=PQ
Money Supply (M) * Money Velocity (V) = Price level (P) * Real economic output (Q)
Which means Money Supply * Money Velocity = Nominal GDP
Therefore, Money Velocity = Nominal GDP/Money Supply
We have the numbers for both Money Supply (from OECD – Organization for Economic Co-operation and Development) and Nominal GDP (from Eurostat) for the Euro Area.
Continue reading “Euro Area or Eurozone Money Velocity seems to be shockingly low”
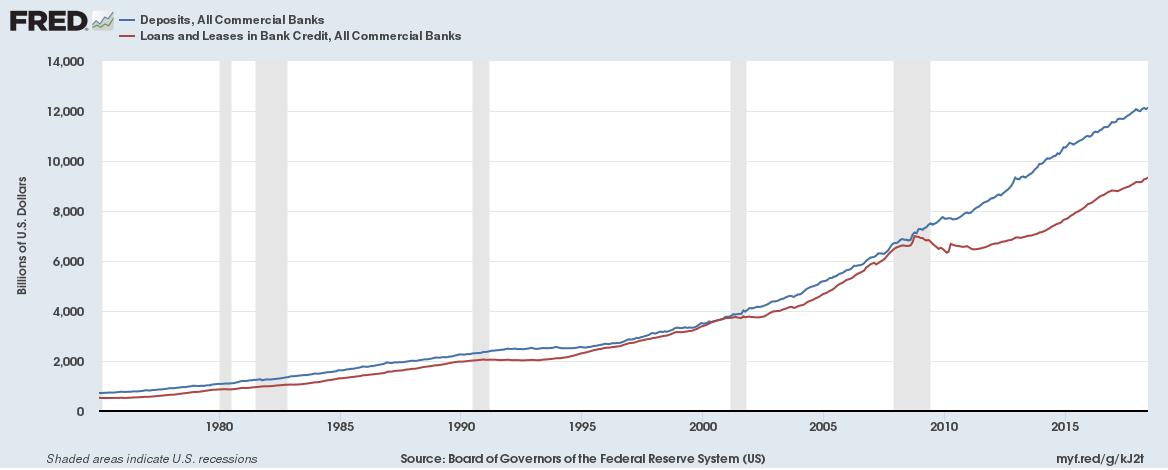
Banks in the United States have a problem – they can’t find enough customers to lend money to
Since the financial crisis of 2008-2009 the difference between bank deposit growth and bank loan growth in the U.S. diverged in a big way, graph below,
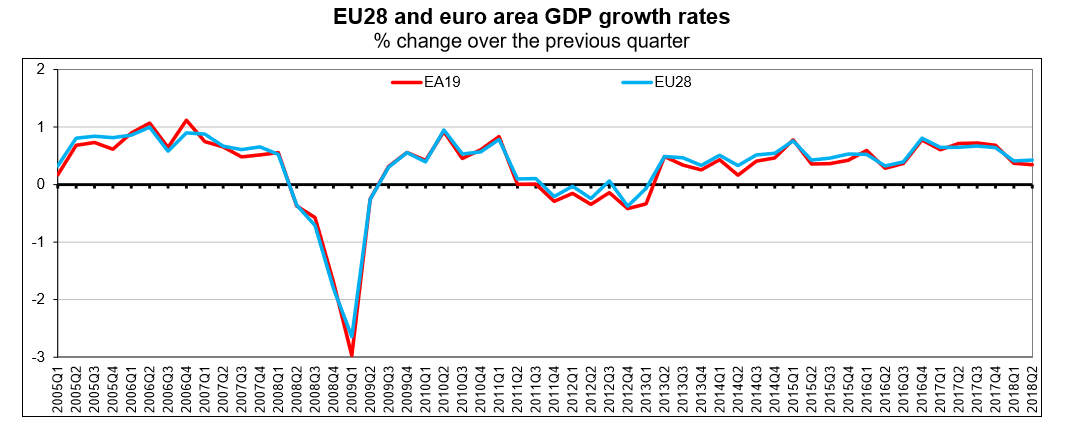
Eurozone Q2 2018 GDP up by 0.3% and European Union Q2 2018 GDP up by 0.4% as Household saving rate falls to the lowest in over a decade
Seasonally adjusted GDP rose by 0.3% in the Eurozone and by 0.4% in the European Union (EU28) during the second quarter (Q2) of 2018, compared with the previous quarter, according to a preliminary flash estimate published by Eurostat, the statistical office of the European Union.
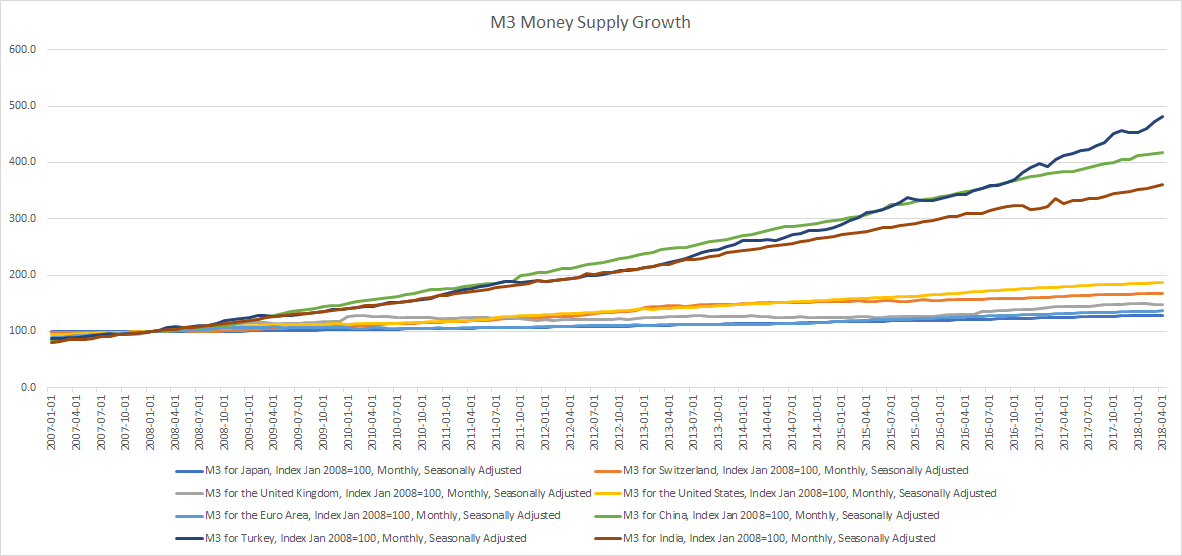
Here’s how much money supply has grown for major economies in the past decade (2008 to 2018)
Broad Money M3
Broad money (M3) includes currency, deposits with an agreed maturity of up to two years, deposits redeemable at notice of up to three months and repurchase agreements, money market fund shares/units and debt securities up to two years.