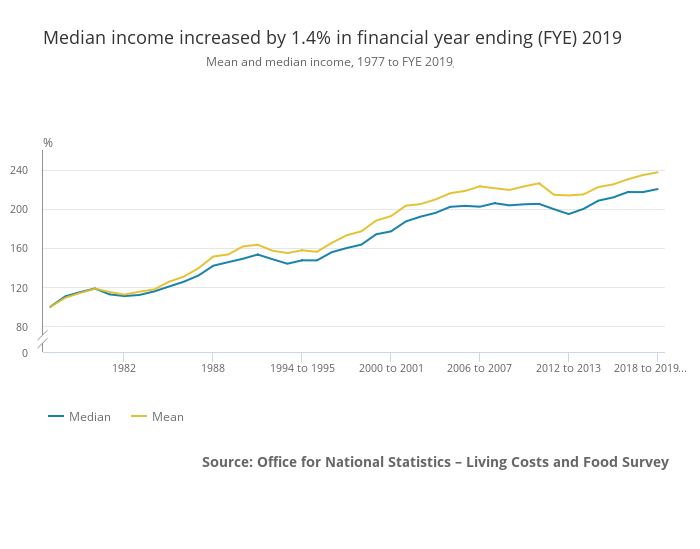
Median household disposable income in the UK was £29,400 at the end of the financial year 2019, up 1.4% or £400 compared to the end of the financial year 2018, after accounting for inflation.
Median household income in the United Kingdom grew by an average of 0.7% per year between the end of financial year 2017 and the end of financial year 2019, compared with 2.8% between the end of financial year 2013 and end of financial year 2017.
Mean income displayed a similar pattern of growth. The provisional estimate at the end of the financial year 2019 for mean household income was £35,300, an increase of 1.2% or £400 from compared to the end of the financial year 2018. This is the sixth consecutive year of growth, growing at an average of 1.8% per year.
The distribution of people’s household disposable income is skewed towards higher income people; mean income (£35,300) is £5,900 larger than median income (£29,400).
Mean and Median income – which is a better measure?
The mean measure of income divides the total income of individuals by the number of individuals. A limitation of using the mean is that it can be influenced by just a few individuals with very high incomes and therefore does not necessarily reflect the standard of living of the typical person. However, when breaking down changes in income and direct taxes by income decile or types of households, the mean allows for these changes to be analysed in an additive way.
The median household income is the income of what would be the middle person, if all individuals in the UK were sorted from poorest to richest. Median income provides a good indication of the standard of living of the typical individual in terms of income.
Both measures are equivalised, meaning that they consider that households with more people will need a higher income to achieve the same standard of living as households with fewer members.
Wages, pensions and higher starting tax thresholds contributed to the increase
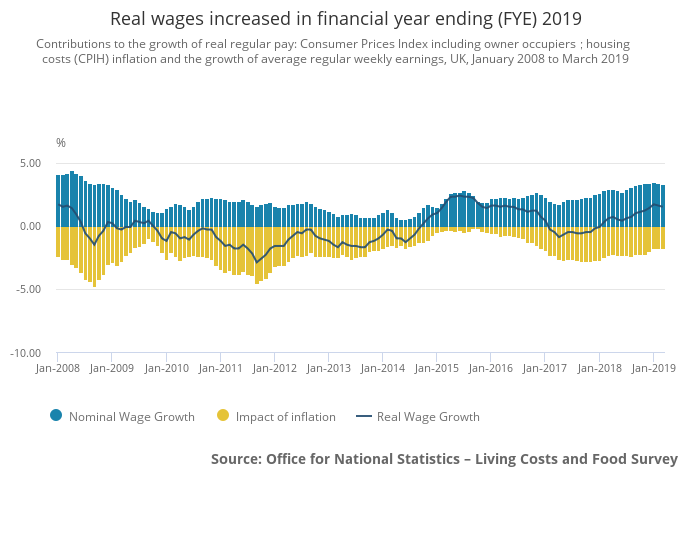
Wage growth
An important influence on levels of growth in average household incomes in financial year 2019 has been the improvement in real wages between financial year 2018 and financial 2019. Over this period, real wages increased by an average of 1%, following an increase in nominal earnings, coupled with a moderation in price growth. The National Living Wage also increased from £7.50 per hour to £7.83 per hour (up 4.4%).
Rising employment
Alongside growth in average real earnings during financial year 2019, the employment rate increased from 75.6% to 76.1%.
Rising personal tax allowance
In addition, there were some policy changes that will have had an impact on changes in household income. In financial year 2019, the personal allowance rose from £11,500 to £11,850, while the starting point for the 40% higher tax rates increased from £45,000 to £46,350.
Pension rises
The basic State Pension increased in line with the “triple guarantee” (or “triple lock”) that was introduced in financial year 2012. The current guarantee ensures that it increases by the highest of the increase in earnings, price inflation (as measured by the Consumer Prices Index (CPI)) or 2.5%. From April 2018, the basic State Pension increased by 3%, matching the CPI inflation rate for September 2017.
Benefits freeze
However, there was also a continued freeze on certain working-age benefits, such as Housing Benefit, Child Benefit and Tax Credits, which remained at financial year (ending March) 2016 cash values. This contributed to the average value of benefits received by non-retired households falling in real terms between financial year 2018 and financial year 2019.
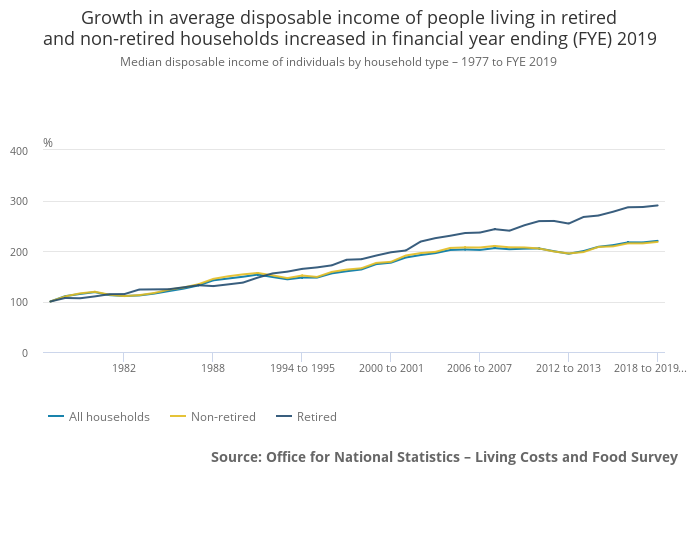
Retired vs non-retired households
Median income for people living in retired households grew by 1.1% at the end of financial year 2019 to £24,600. This will likely be partly influenced by the State Pension which increased by 3% in April 2018 – a real terms increase over FYE 2018
Median income for people living in non-retired households increased by 1.3% at the end of financial year ending 2019 to £30,700. This is the sixth consecutive increase, during a period in which their median income grew by an average of 2.1% per year.
A retired person is defined as anyone who describes themselves (in the Living Costs and Food Survey) as “retired” or anyone over minimum State Pension age describing themselves as “unoccupied” or “sick or injured but not intending to seek work”. A retired household is where the combined income of retired members amounts to at least half the total gross income of the household.
Related:
The UK faces three immediate economic challenges irrespective of what happens with Brexit
Here are UK household spending insights
The UK’s net worth is now estimated at £10.2 trillion, an average of £155000 per person
This is how wealthy UK households are
UK households have seen their outgoings surpass their income for the first time in nearly 30 years