Europe’s aging population is set to cause huge economic challenges

We wrote about population percentage for each country by age last year. Here’s a map of population percentage for age 65 and above:

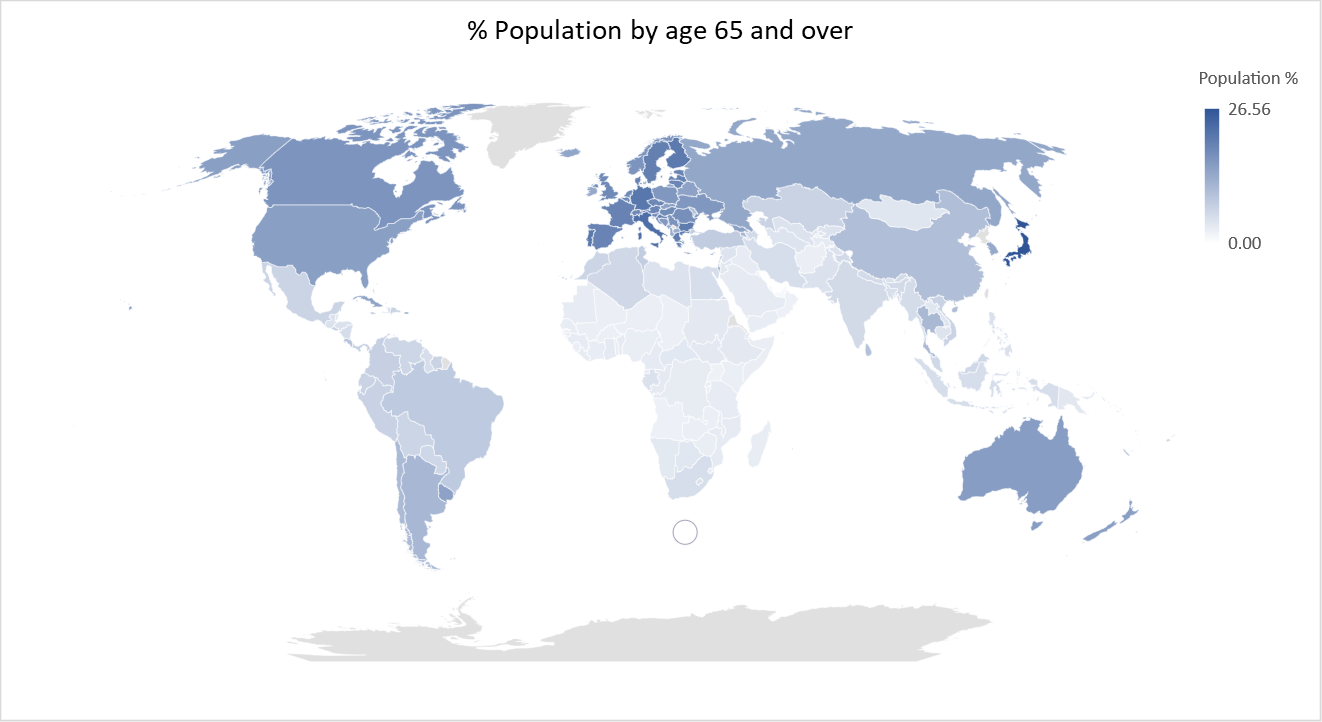
Japan has the highest percentage of over 65s at 26.56%. The other countries that make the top 25 countries for over 65s population are Italy, Germany, Portugal, Finland, Bulgaria, Greece, Sweden, Denmark, France, Croatia, Spain, Estonia, Austria, Malta, Lithuania, Czech Republic, Slovenia, Belgium, Netherlands, United Kingdom, Switzerland and Hungary all of which are in Europe.

Continue reading “Europe’s aging population is set to cause huge economic challenges”

UK household credit growth remains robust despite Brexit as outstanding household debt hits 80% of GDP

Household credit growth has been slowing around most of the world including the United States, Canada and Australia but remains robust in the United Kingdom despite economic concerns around Brexit. Household debt excluding student loans has hit 80% of GDP and including student loans has hit 90% of GDP.

Continue reading “UK household credit growth remains robust despite Brexit as outstanding household debt hits 80% of GDP”

Healthcare has displaced Retail as the largest employer in the United States

Some 16.2 million people now work in the Healthcare sector in the United States. Healthcare has displaced Retail as the largest employer in the United States and has been the biggest job creator since the 1990s. 10.8% of all nonfarm jobs are now in healthcare. Here’s a graph of the growth of healthcare jobs,

US total healthcare payrolls 1990 to 2018   Continue reading “Healthcare has displaced Retail as the largest employer in the United States”

2019, a year that will be different

At the outset, we wish you a Happy New Year!

Today, the 3rd of January has been a record day every year (for at least the last 15 years) for several things. For starters you have online returns (in the U.S. and the U.K.), gym memberships and dating website(s) signups peaking on the day. But this year is different so expect the unexpected. We can’t write about everything today but cover four topics (Retail, Technology, Interest Rates and Debt).

2019

Continue reading “2019, a year that will be different”

Are bad loans really increasing for banks in the United States?

Just three charts hold the answer …

We wrote earlier during the year that U.S. consumer and commercial debt hit record highs but charge-off and delinquency rates remained at low levels. We will write about bad loans by each product again in the new year but meanwhile just three charts hold the answer to the question on whether bad loans are really increasing for banks in the United States.

Continue reading “Are bad loans really increasing for banks in the United States?”

Those three U.S. recession indicators – how near or far are those from being invoked? End of 2018 edition

We wrote about three slightly different U.S. recession indicators that have been predictive of the past few recessions and have been tracking how near or far are those from being invoked, here’s where we are at the end of 2018,

Continue reading “Those three U.S. recession indicators – how near or far are those from being invoked? End of 2018 edition”

Some aviation statistics for the European Union

A record of over 1 billion air passengers travelled by air in the European Union in 2017. In 2017, 1.04 billion passengers travelled by air in the European Union (EU), up by 7% compared with 2016 and by 39% compared with 2009.

In 2017, intra-EU transport represented almost half (47%) of total air passenger transport in the EU and extra-EU transport over a third (36%), while national transport accounted for fewer than 1 in every 5 passengers (17%).

Air passenger traffic in the European Union 2017
Source: Eurostat

Continue reading “Some aviation statistics for the European Union”

Here’s how much European Union Member states spend on social protection as percentage of GDP

Social protection expenditure in the European Union (EU) stood at 28.2% of GDP in 2016. In 2016, the two main sources of funding of social protection at EU level were social contributions, making up 55% of total receipts, and general government contributions from taxes at 40%.

Social protection expenditure by European Union member state
Source: Eurostat

Continue reading “Here’s how much European Union Member states spend on social protection as percentage of GDP”