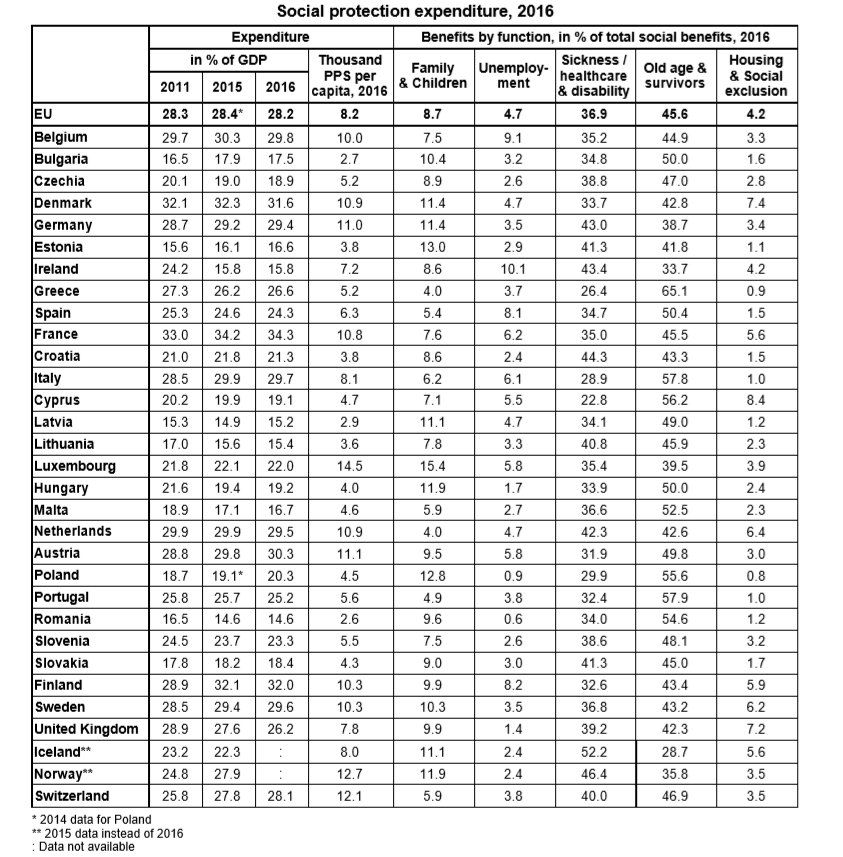
Social protection expenditure in the European Union (EU) stood at 28.2% of GDP in 2016. In 2016, the two main sources of funding of social protection at EU level were social contributions, making up 55% of total receipts, and general government contributions from taxes at 40%.
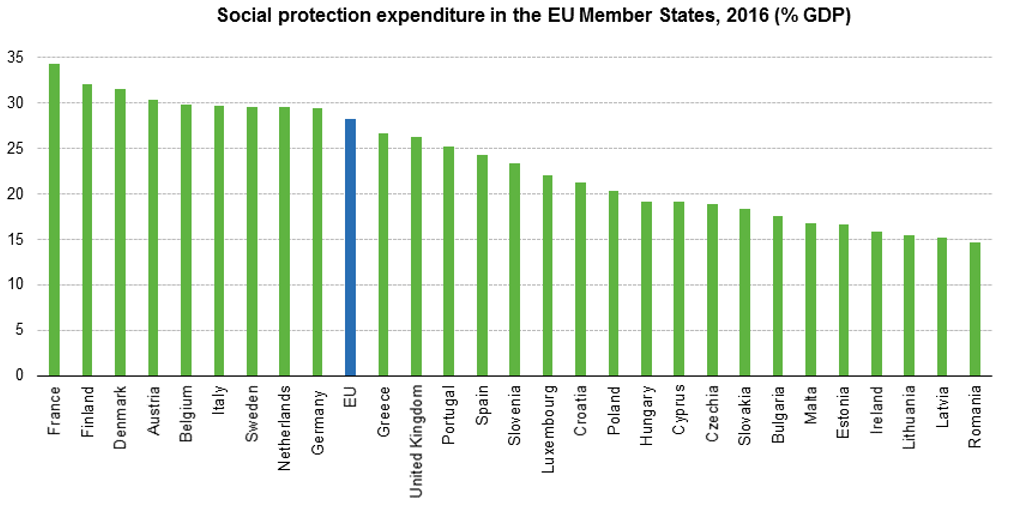
The EU average continued to mask major disparities between Member States. In 2016, social protection expenditure represented at least 30% of GDP in France (34%), Finland and Denmark (both 32%) as well as in Austria, Belgium, Italy, Sweden and the Netherlands (all 30%). In contrast, social protection expenditure stood below 20% of GDP in Romania, Latvia and Lithuania (all 15%), Ireland (16%), Estonia and Malta (both 17%), Bulgaria and Slovakia (both 18%) as well as Czechia, Cyprus and Hungary (all 19%).
The European Union (EU) currently includes Belgium, Bulgaria, Czechia, Denmark, Germany, Estonia, Ireland, Greece, Spain, France, Croatia, Italy, Cyprus, Latvia, Lithuania, Luxembourg, Hungary, Malta, the Netherlands, Austria, Poland, Portugal, Romania, Slovenia, Slovakia, Finland, Sweden and the United Kingdom.
Related:
Past, present, future – some demographic and economic statistics for the European Union