Who saves the most?
Continue reading “Here are Household Saving rates across the European Union”
Why wouldn’t it be?
Who saves the most?
Continue reading “Here are Household Saving rates across the European Union”
The European Commission slashed their GDP growth forecast for the European Union (excluding the United Kingdom) and the Eurozone for 2019 and 2020 citing slowing growth in China and weakening global trade.
The growth forecast for 2019 for the European Union (excluding the United Kingdom) was cut to 1.5% for 2019 (was previously forecast 2%) and for the Eurozone was cut to 1.3% (was previously forecast 1.9%).
Germany, Italy and the Netherlands all saw big downgrades for their growth outlook.
There are various ways to look at Household Debt (total debt outstanding including mortgages, loans, credit cards and other debt) in the United States, we look at two today.
The first is debt servicing costs to disposable income which effectively is how much it costs to service household debt as a fraction of disposable (after tax) income. The second is household debt outstanding to disposable income which effectively is how much debt there is with respect to the same disposable (after tax) income measure.
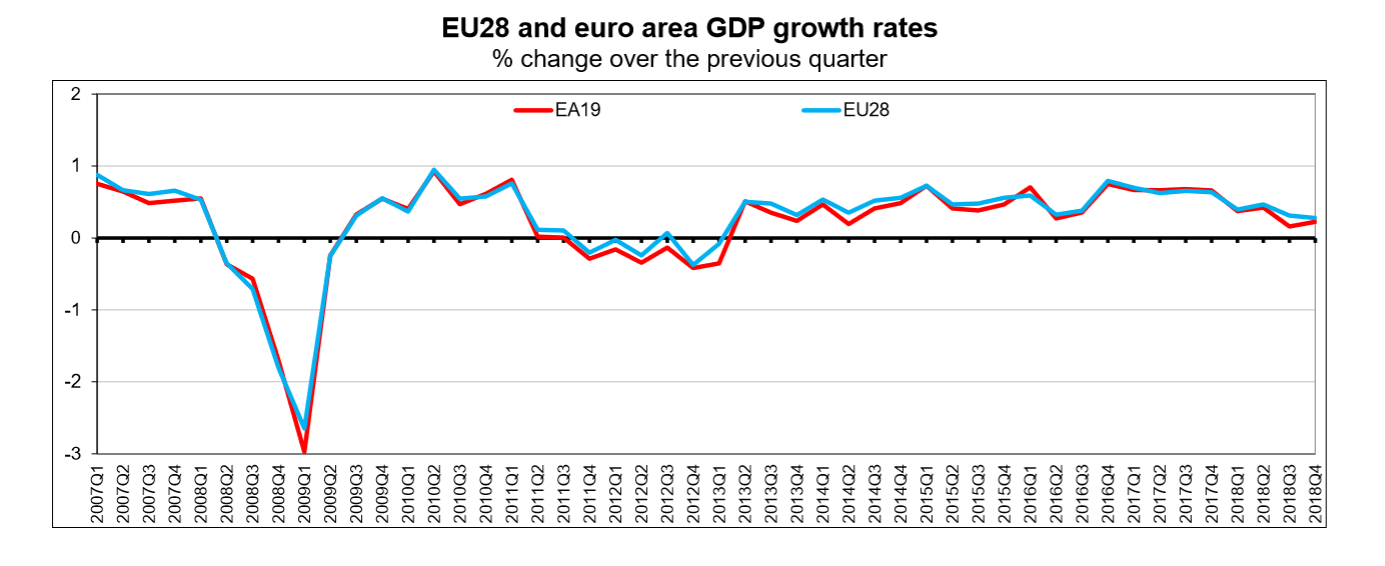
Seasonally adjusted GDP rose by 0.2% in the Euro area or Eurozone (EA) and by 0.3% in the European Union (EU) during Q4 2018, compared with Q3 2018.
22 out of the 28 Member States of the European Union (EU) currently have national minimum wages. The 6 countries in the EU that do not currently have any minimum wage level set are Denmark, Italy, Cyprus, Austria, Finland and Sweden.
Continue reading “Here are the minimum wage levels across the European Union”
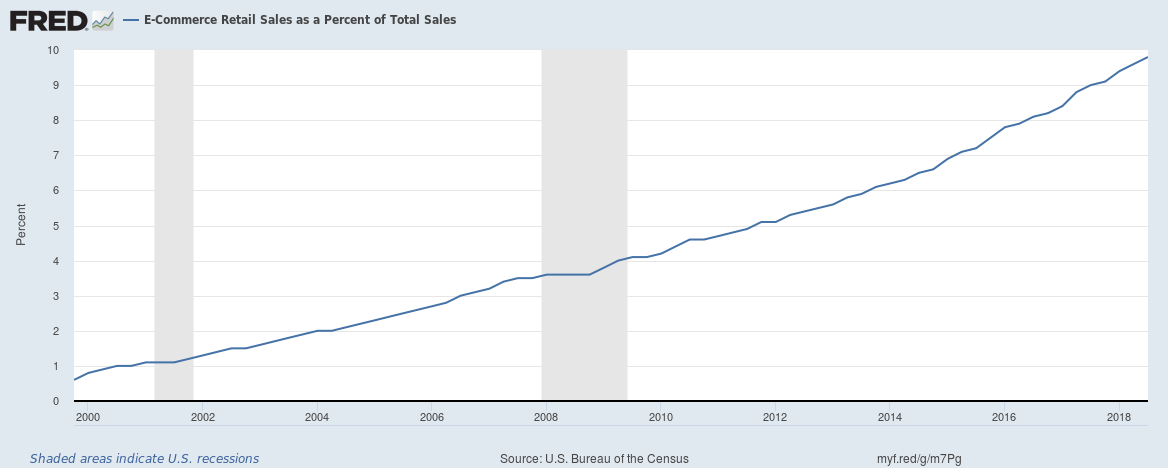
Chart 1: E-Commerce Retail Sales as a Percent of Total Sales
E-Commerce retail sales are now 9.8% of total retail sales (at the end of Q3 2018). Amazon is estimated to be 50% of all E-Commerce sales in the U.S. which would mean Amazon accounts for around 5% (or $1 in every $20 spent) of all retail sales in the U.S.
Continue reading “The growth of E-Commerce in the United States in three charts”
We answered the question whether bad loans were really increasing for banks in the United States at the end of December. We look at Delinquency and Charge-off rates across banks for United States across different products in this post.
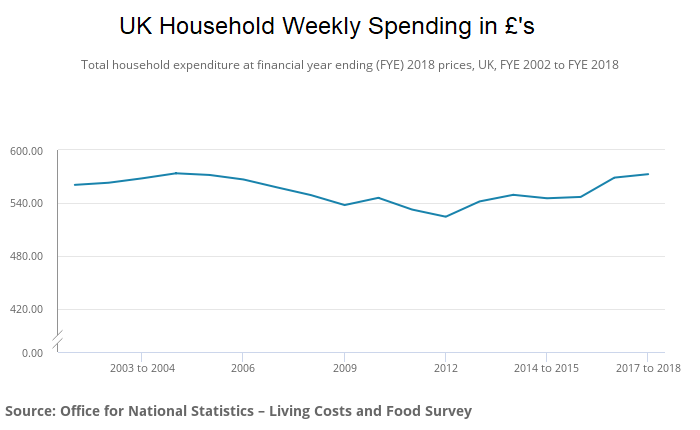
Here are insights into the spending habits of UK households by region and type of spending based on living costs and food survey of the Office for National Statistics.
Average weekly household expenditure in the UK was £572.60 in the financial year ending 2018; the highest weekly spend since the financial year ending 2005, after adjusting for inflation.
One big impact of the U.S. tax cut for corporations has been that corporate taxes now just contribute 8.3% of all U.S. federal taxes. As import tariffs rise, custom duties have been rising at a staggering rate, and tariffs on imported goods together with taxes levied at production now contribute 8.1% of all U.S. federal taxes. Taxes paid by individuals contribute the vast majority or 82.3% of all U.S. federal taxes.
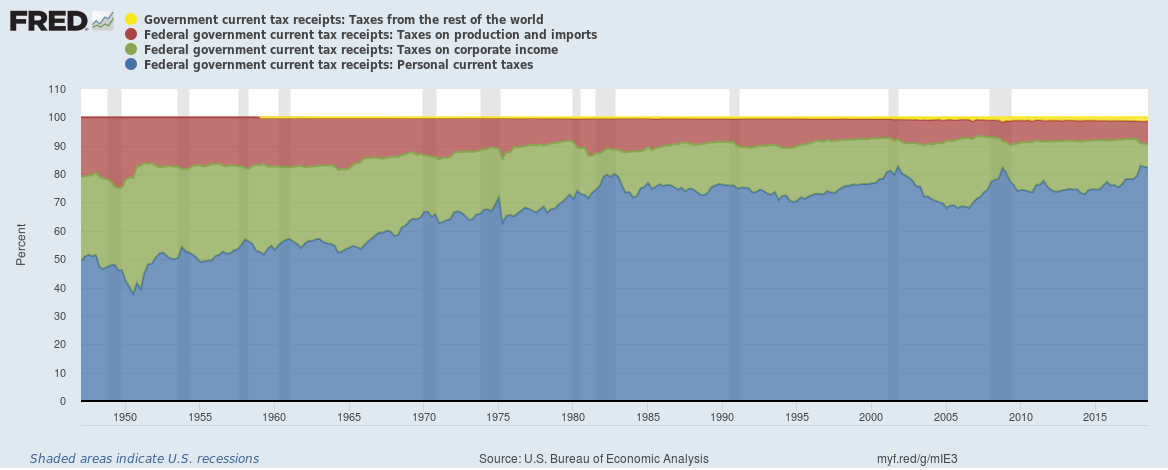
Continue reading “Individuals now consistently contribute over 80% of all U.S. federal taxes”
In September last year we wrote why wages weren’t rising despite record employment and labour shortages and earlier this month we wrote that U.S. Corporate profits have been growing well and have hit a record high. We explore another angle, total wages (wages including bonuses and overtime – all before taxes) to the corporate profits (before taxes) ratio.