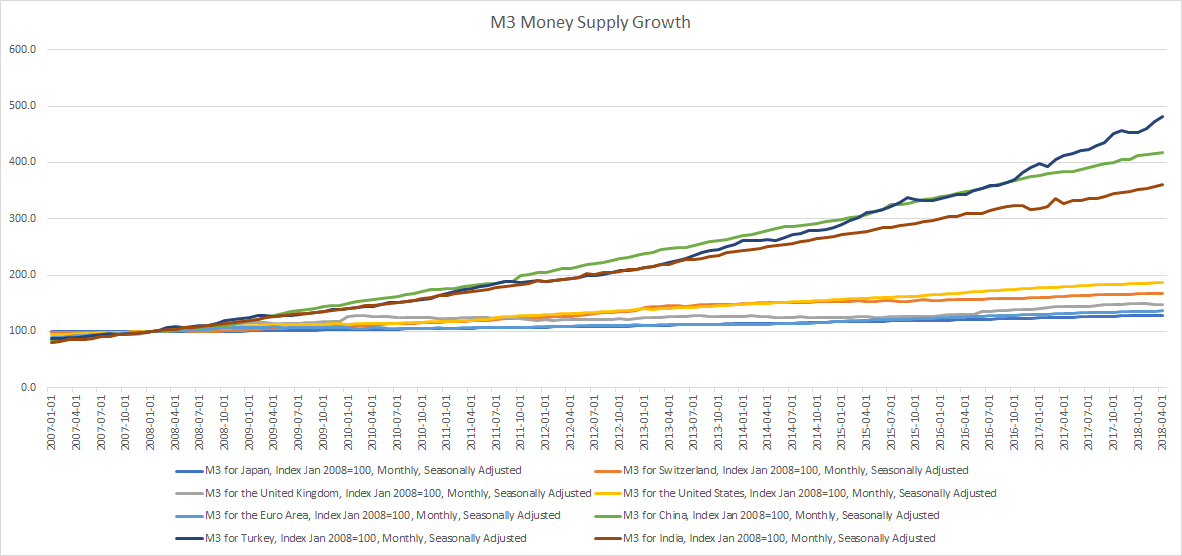
Broad money (M3) includes currency, deposits with an agreed maturity of up to two years, deposits redeemable at notice of up to three months and repurchase agreements, money market fund shares/units and debt securities up to two years.
Source: Organization for Economic Co-operation and Development
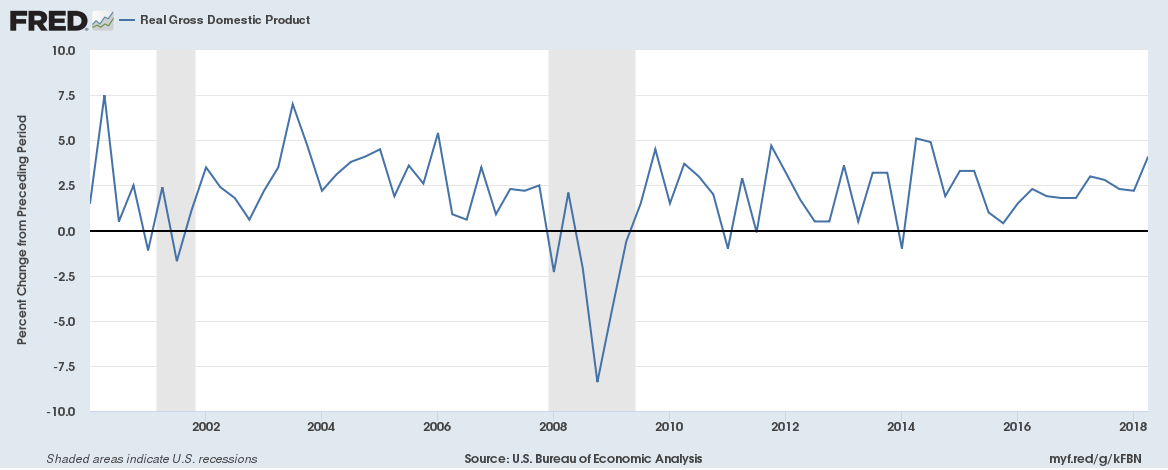
Real gross domestic product for the United States increased at an annual rate of 4.1% in Q2 2018 according to the advance estimate released by the Bureau of Economic Analysis.
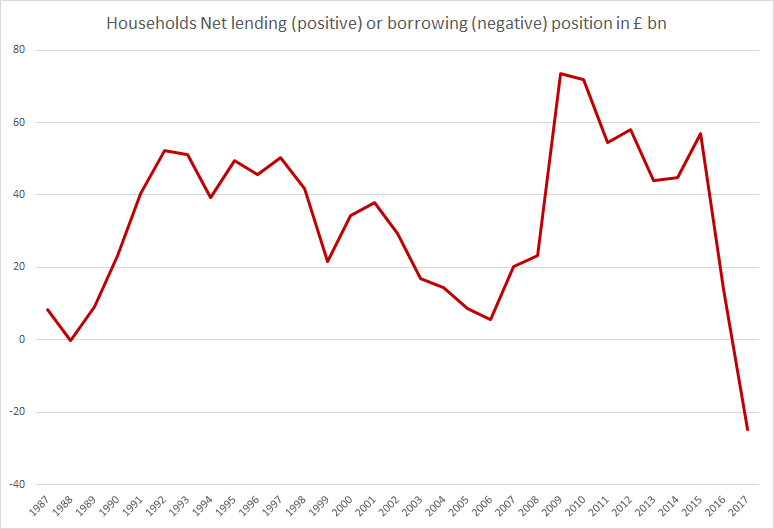
Households in the United Kingdom have seen their outgoings surpass their income for the first time in nearly 30 years as per a release from the Office for National Statistics.
On average, each UK household spent or invested around £900 more than they received in income in 2017. The total amounted to almost £25 billion for all households in the UK. Households’ outgoings last outstripped their income for a whole year in 1988, although the shortfall was much smaller at just £0.3 billion back then.
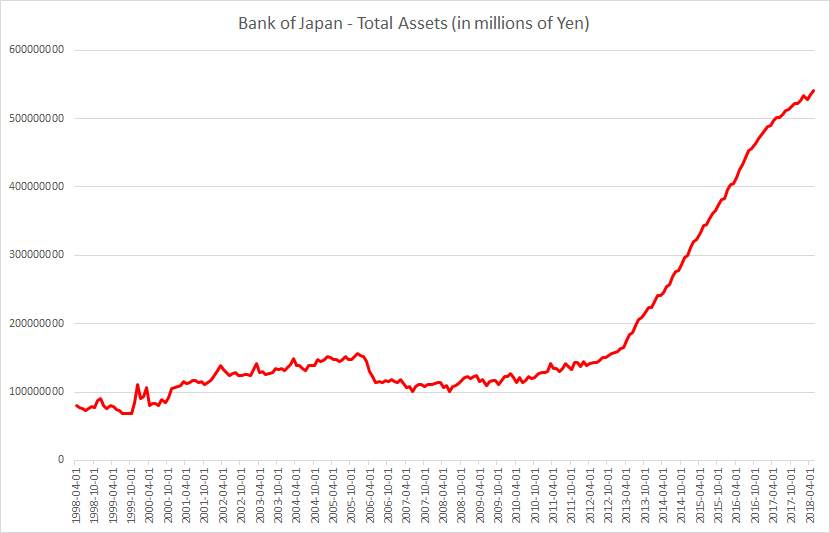
Central Banks have grown their balance sheets significantly in the past 20 years and almost exponentially since the 2008 financial crisis. Here’s how much the balance sheets of the Bank of Japan, the Swiss National Bank, the Federal Reserve and the European Central Bank have grown in the 21st century,
Bank of Japan
Total assets: 540.8036 trillion Yen (JPY) = 4.93 trillion US Dollars (USD)
As of date: May 1, 2018
Asset size as percentage of GDP: 101% of GDP
Interesting information: The Bank of Japan has a target to buy 6 trillion Yen ($54 billion) worth of exchange traded funds a year. It now holds almost 82% of all ETFs in Japan and is indirectly the largest shareholder in many large Japanese companies, almost about half of listed companies in Japan.
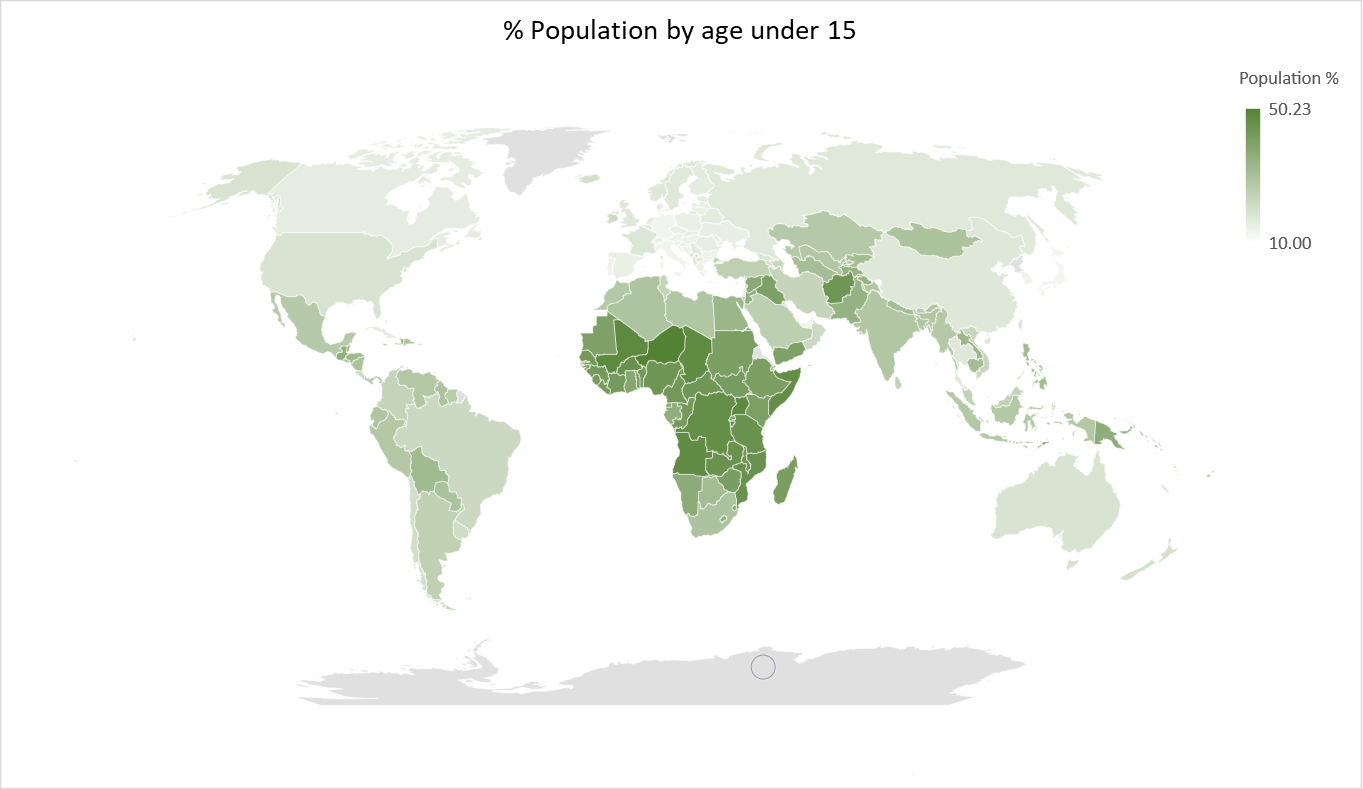
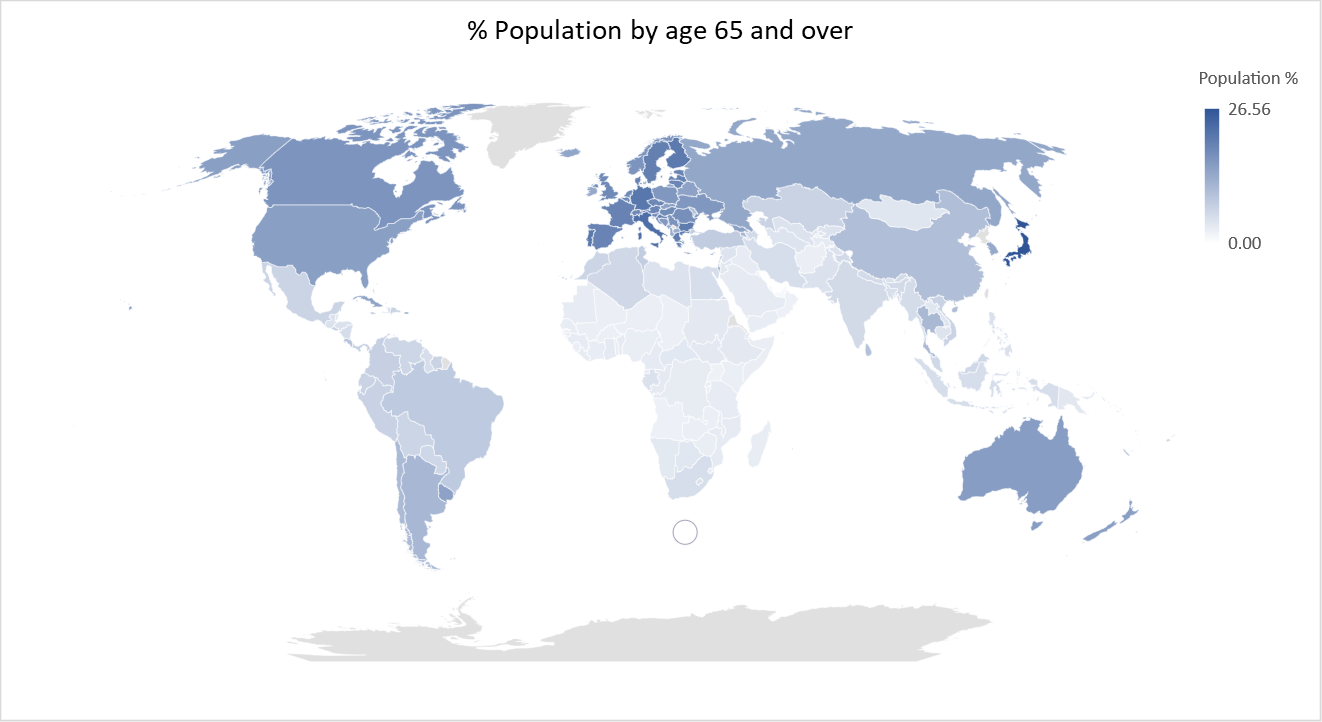
We recently posted about population percentage for each country by age. The data was for 2016 from the World Bank and is the latest set of available data. Here is a map of population percentage for age 65 and above: